You followed a whale into an unusual trade, but how do you know if they are still holding?
Did the whale take profits already?
Did they bail out of the losing position?
Are they adding to it?
We saw them enter, but how do we track what happens next?
Flow Trading
Flow Trading relies on watching the Options Flow via a platform such as Black Box Stocks. Most of us will usually be watching the Ask and Above the Ask Call Flow, or are busy doing a day job, which means we may not always notice when a whale gets out of the flow that we followed them into.
That is where the primary goal of the GetThatCashMoney OI Tracker comes in. We track the Open Interest from the time you enter it into the system. When the whale gets out, you will see it in the Open Interest Chart for that symbol, as well as being called out on the Alerts component.
If you see a whale exit the flow, thats your signal to reevaluate your trade. The reason you took the trade (follow the flow) may now be invalidated, and you should determine your exit strategy.
Likewise, an options price may have dipped by 50% and you are struggling to decide if you should stay in the trade. Knowing if the whales are still holding (or better yet buying the dips) can guide you on whether to average down, or cut your losses.
GetThatCashMoney just makes it easier to manage your flow trades and keep your eyes on it.
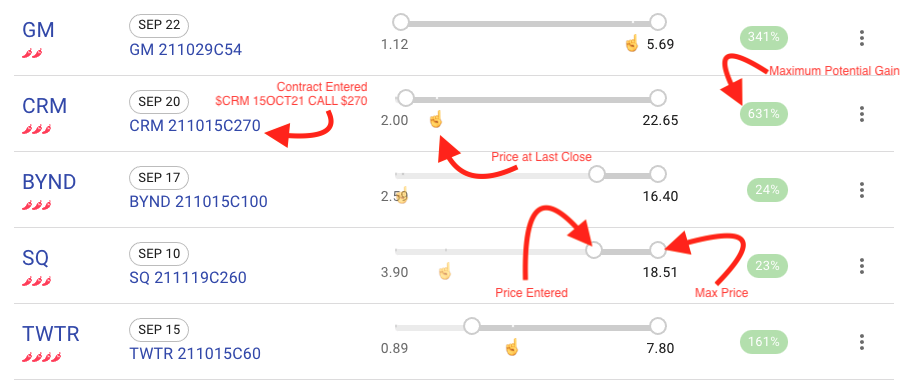
Step 1: Reading the Public Flow Table
The public flow table displays some of the Flow Trades that are called out by OptionsMafia (aka Charlie) on the Black Box Stocks platform. I dont necessarily publish all the callouts made, but many of them are there. You can track your own yourself via your Private Journal.
The purpose of the Public Flow Table is to give you a quick glance at what flow has a high probability of success. You can also at a glance see the price the flow came in at (the Entry Price), and the maximum potential gain based on where the contracts went over time (based on Robinhood API data). A pointed finger also shows the price the contracts last closed at (previous day).
Step 2: Track the Open Interest
The high probability flow plays we get into by watching the Black Box Stocks platform are found by following the really big whales. The ones that are dropping high dollar amounts into contracts. Usually this entails $1M+ going into a single options contract/strike/expiration. Sometimes we will see smaller amounts that still exceed Open Interest into unusual names with shorter expirations. Basically, we are looking or unusual activity with significant money behind it for a given ticker.
Once we have followed a whale into a contract, it is critical that we know if they left. Ideally we see it realtime by monitoring the flow on Black Box Stocks. However, some of us have day jobs or meetings we have to attend to and cant watch the screen all day long. Other times, we may only be looking at new positions being opened and may miss when a position is being closed out.
This is where the core power of GetThatCashMoney comes in. We track the Open Interest (OI) on flow plays and alert if we see a whale exit.
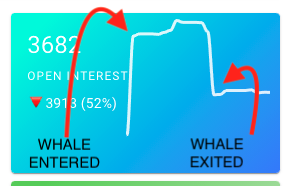
The Open Interest graph above shows how the OI has changed over time. Tracking starts from the first time a user of GetThatCashMoney starts tracking the contract. We stop tracking the OI once the contract expiration date has been reached.
Another advantage is when the price of a contract has significantly pulled back and you start to see the whales add to their position. You can quickly see on the site where the OI currently sits, and get the confirmation the next day on the increased OI. This helps you plan your trading approach.
If you follow a whale into a trade, you generally want to follow them out also.
Occassionally, we may see a whale perform Multileg (ML) transactions, where they roll out of one strike in favor of another. Black Box Stocks is one of the only platforms that will give you that information. GetThatCashMoney.com will allow you to track the OI and confirm if they did infact roll out of a contract you have been tracking.
Step 3: Understanding the Strength Meter
The strength meter is my attempt to value a flow play based on Size, Time, and Urgency.
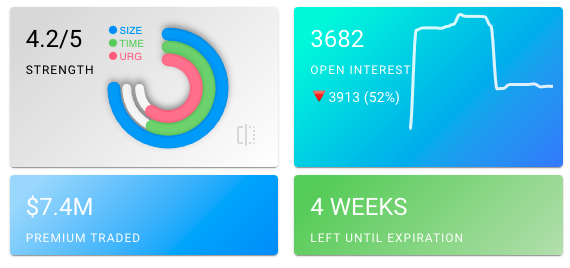
Various aspects go into calculating the number, based on the flow exported from Black Box Stocks and then uploaded into GetThatCashMoney.com.
- We look at the amount of premium being traded. We want 1M+ going into a contract for Size to be valued.
- We look at the amount of time on the contracts. Longer dated is ideal. But we also value a lot of size for a short expiration as that is considered aggressive buys.
- We look at the urgency of the trade. Are the buys at Ask or Above the Ask? Above the ask shows urgency and willingness to pay top dollar. Are they sweeps or blocks? Sweeps is a Market Order and is basically saying “Give it to me now!”. A block on the other hand is like pre-negotiating a price (Limit Order) and isnt as aggressive. The final piece we calculate for urgency is if the OI was exceeded in a single sweep, multiple sweeps, or not at all. Exceeding OI shows someone is buying up all available contracts and again pushes urgency to get into a contract (unusual activity).
Step 4: Create your Private Journal
Any serious trader should be considering journaling their trades. Whether you use an online tool, a spreadsheet, or a sheet of paper, it is important to know why you enter and exit a trade, and learn from it to become a better trader.
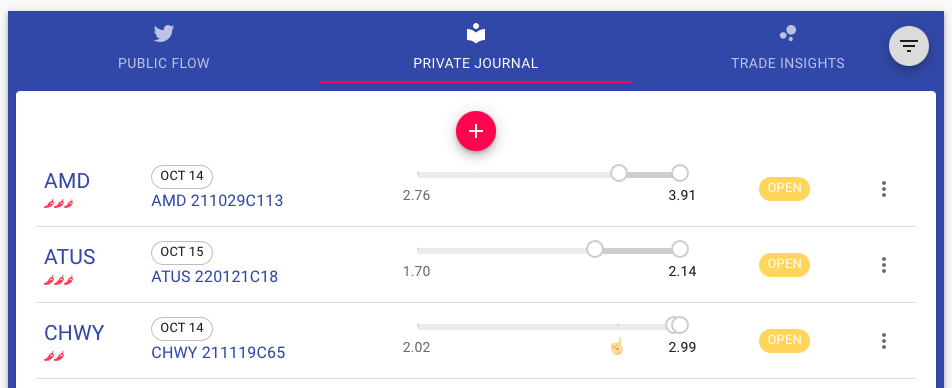
Since GetThatCashMoney already allows you to track the OI on flow trades you may have entered, it is a natural extension to expand into journalling.
After logging in (with your Twitter account), you can start to track your own flow trades (and even copy the public ones by hitting the Watch button in the menu). The Options data will start being collected for that contract from that point forward.
You can then view the Trade Insights tab to see your winning trends, red/green day calendars, and an exportable table of your historical trades. This will help improve your exit strategies by determining if you exit trades too early, when you should set stops to stay in trades longer, etc. You can tag your trades, and potentially start to see trends in your trading style. More to come in this area over time.

LATEST POST

- Post By CashMoneyTrades
- Jan 11, 2023
How To Trade with Bollinger Bands
- Post By CashMoneyTrades
- Dec 03, 2022
How To Gamify Your Trading: Tips and Strategies for Adding Fun and Excitement to Your Trading Routine

- Post By CashMoneyTrades
- Dec 03, 2022