
The Daily Fib Pivots indicator can be used to display the Fibonacci Retracements and Expansions based on the previous days high and low. If you want to learn more about Fibonacci Retracement Levels, Investopedia is an excellent source of information.
In a nutshell, Fibonacci retracement levels are ratio’s between a high and low value, based on Fibonacci percentages.
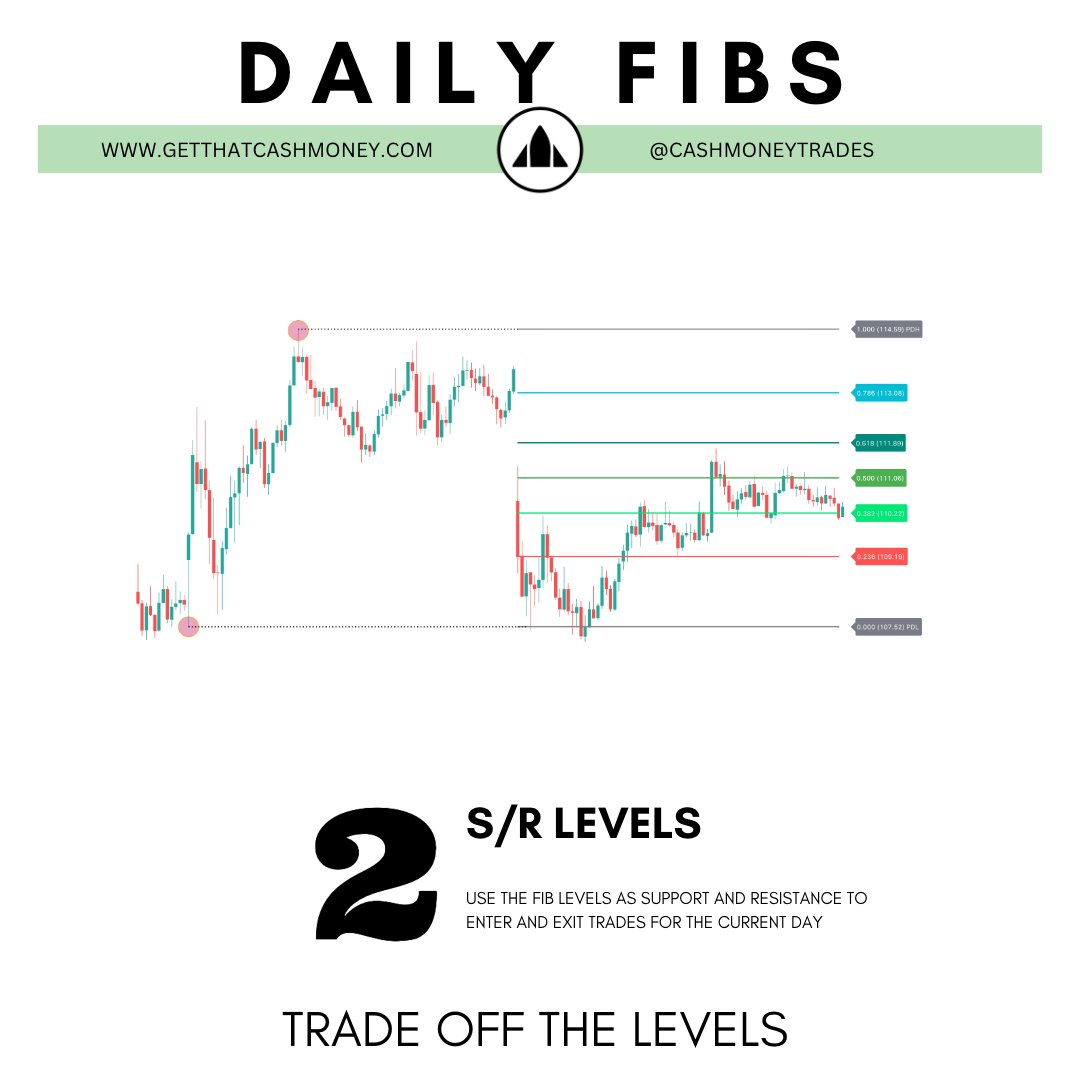
The major Fibonacci levels that we often see price respect are the 23.6%, 38.2%, 61.8%, and 78.6% ratios.
The 50% ratio is also very popular (although not officially a fib ratio).
The Cash+ Daily Pivots Indicator
With the GetThatCashMoney Cash+ Daily Pivots TradingView Indicator, we will automatically plot the Daily Fib Levels using the previous days high and low values.
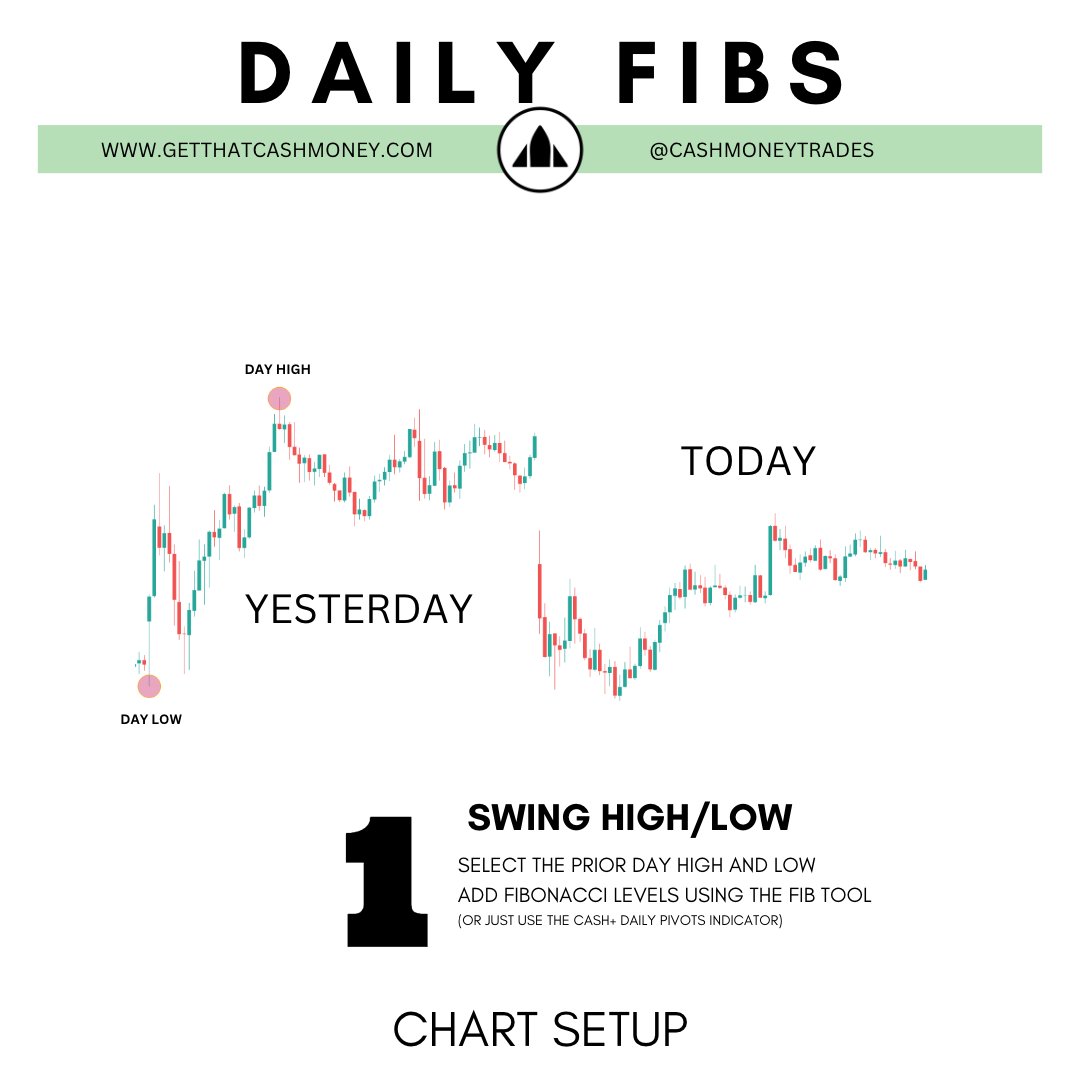
CHART SETUP
TRADES
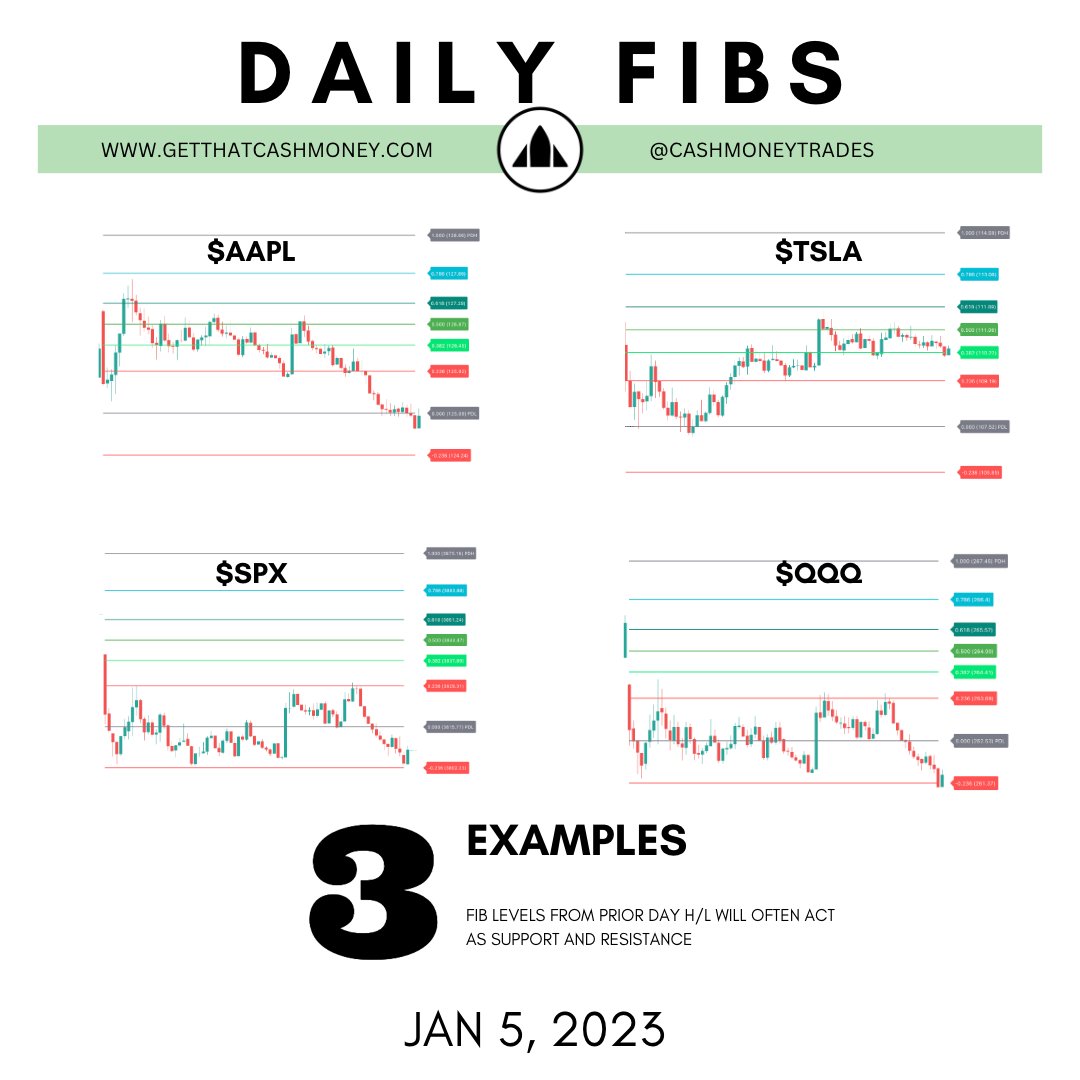
EXAMPLES
You will end up with a chart looking similar to below:
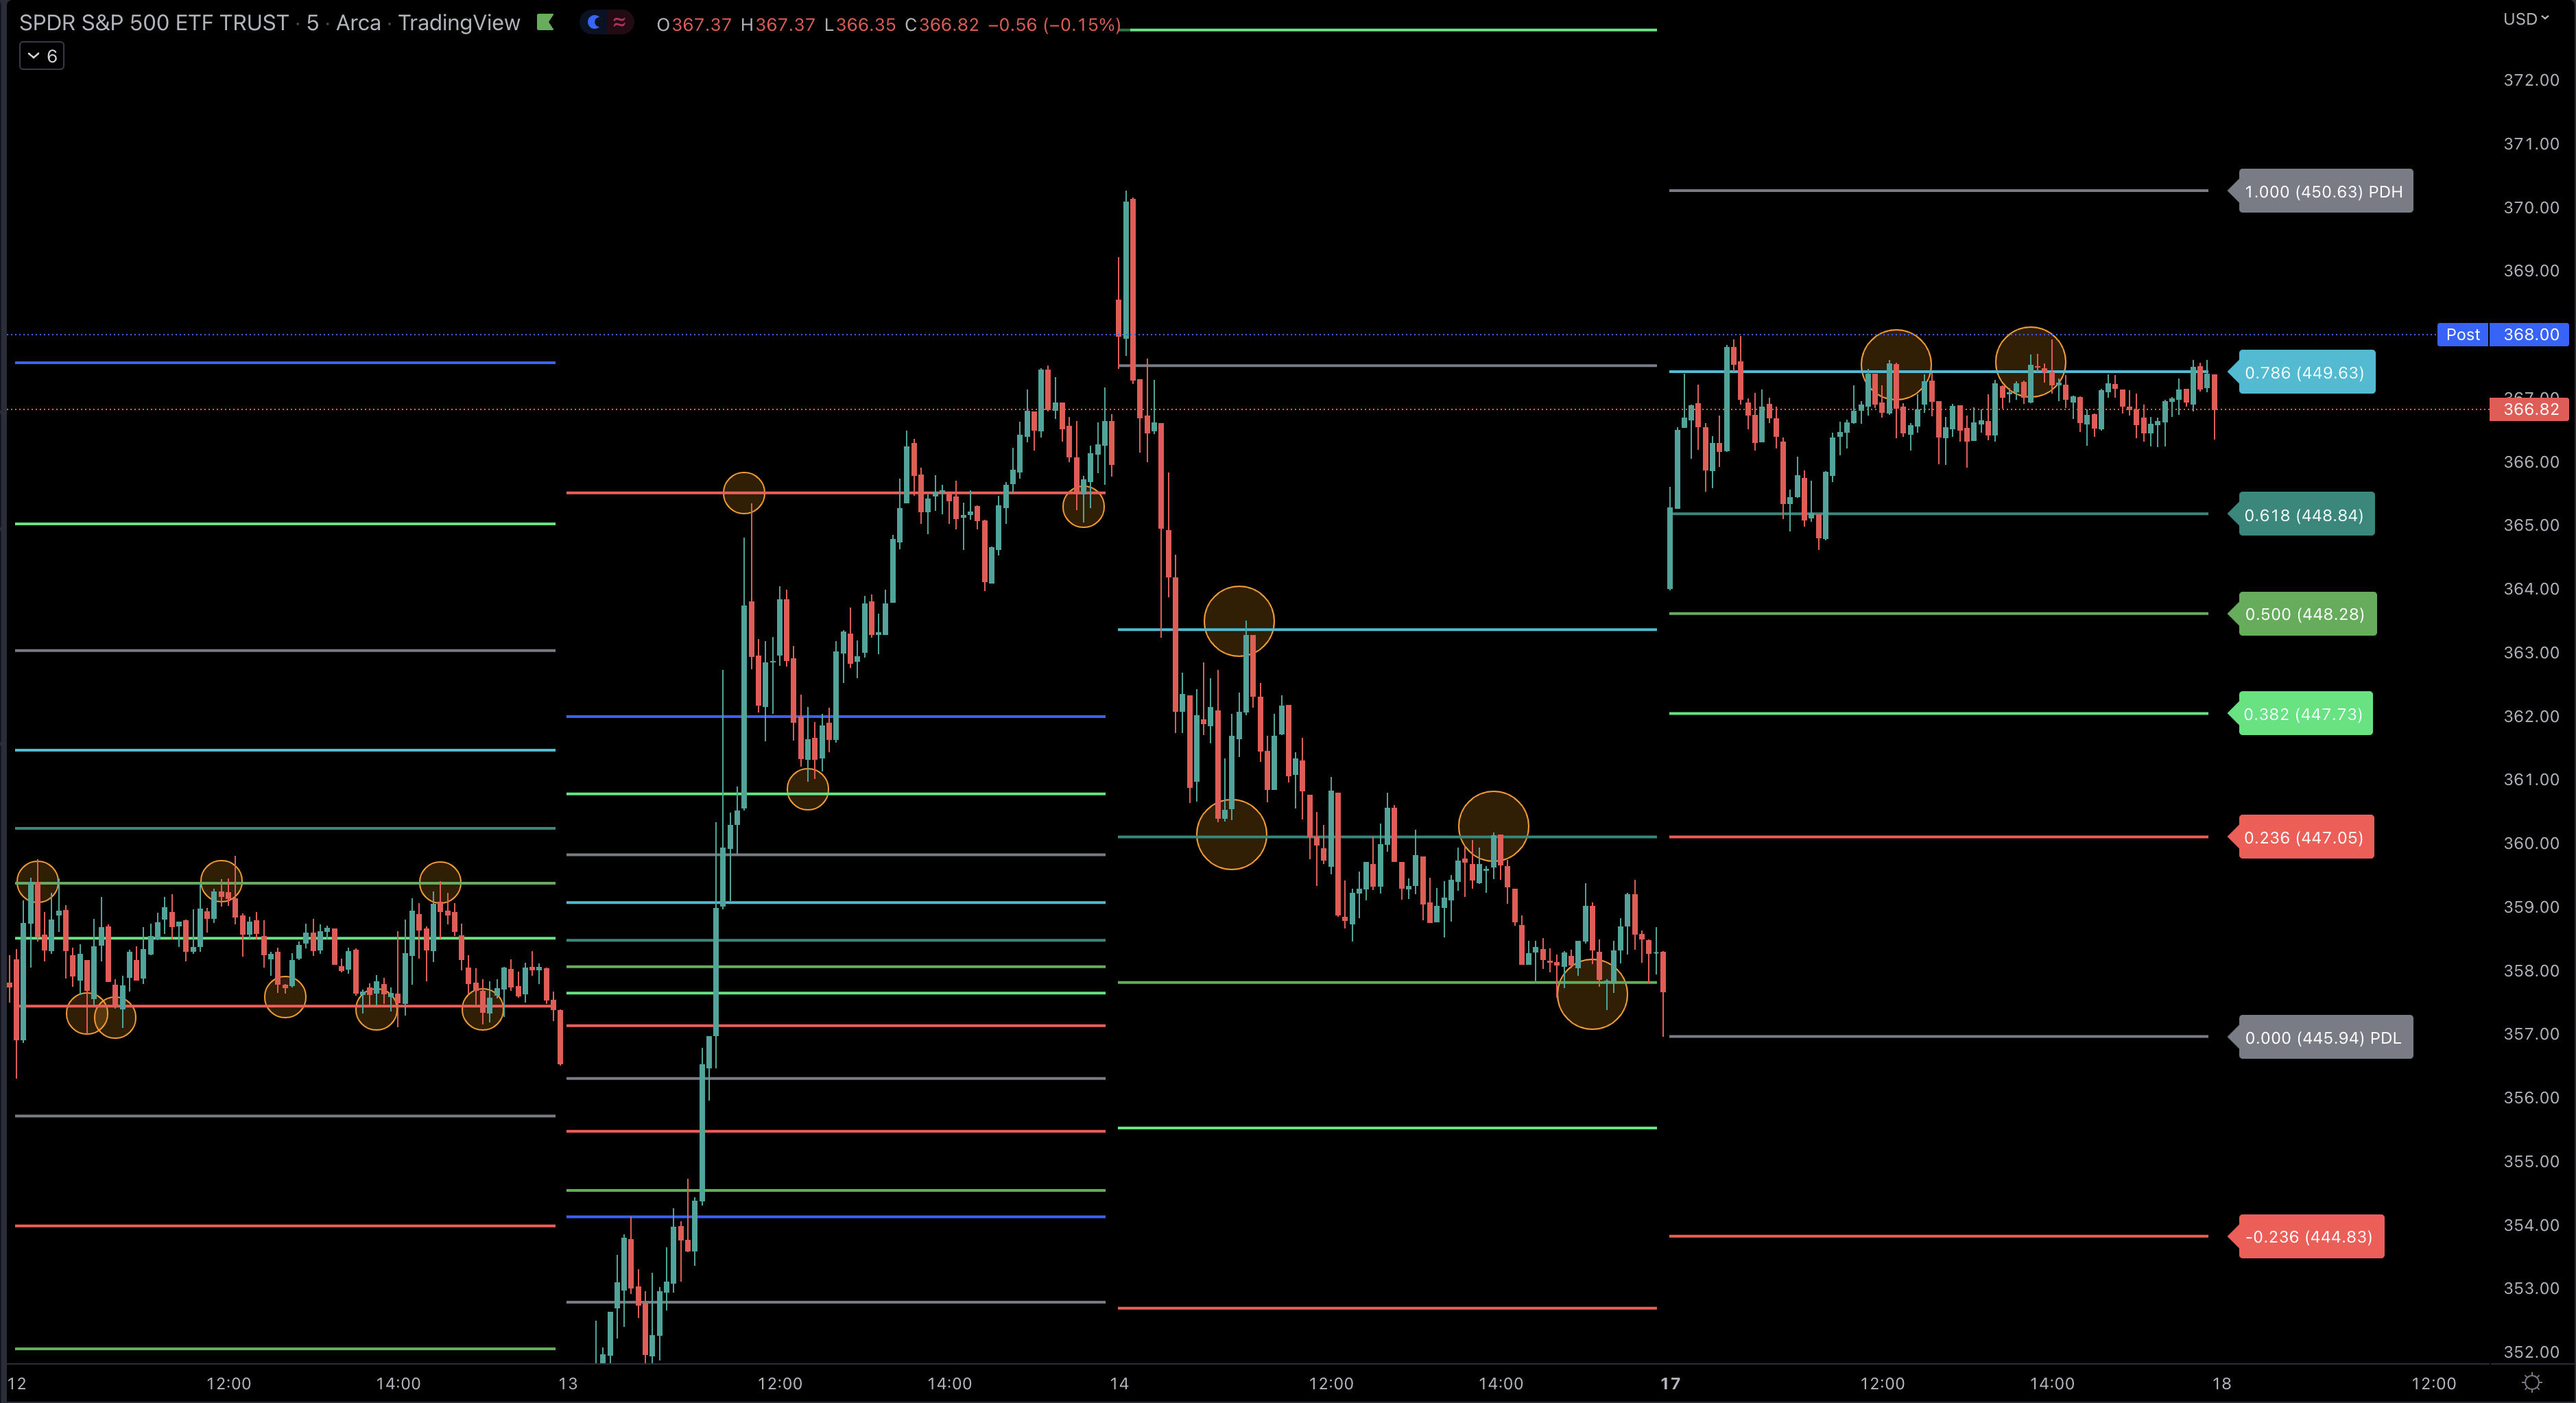
This is a 5m chart of $SPY between Wed Oct 12, 2022 and Mon Oct 17, 2022.
It shows the range for Wed, Thur, Fri, and Mon.
For each date, the gray lines represent the prior day high and low values. The lines in between are the Fib Retracement levels (each color is labeled on the right), and the lines that go above/below the gray high/lows are called the Fibonacci Extensions.
The orange circles were added there by me to highlight the support/resistance touches.
How To Read the Daily Pivots Chart
These daily Fibonacci levels have an uncanny way of becoming areas to watch for support and resistance and allows your to better time your entries and exits as we approach these levels.
As you can see on the first day of the above SPY chart, we traded sideways between the 23.6% and 50% levels - acting as support and resistance.
The next day, we gapped down large due to a bad CPI number, but then rallied an insane amount - yes this was that crazy day in October!. But again, the first bounce was at the -61..8% fib extension (initial downside move), and then we rallied all the way up to the 23.6% level before finding resistance.
Then on Friday, we had largely downside action, but again consolidation was occurring around key daily fib levels.
Today (Monday Oct 17), which is the last day on the above image, we pretty much just traded sideways the entire day, but could not break above the 78.1% level.
How To Trade the Daily Fibonacci Pivots
Now that we know how these daily fibonacci levels play out during the day, we want to trade them.
The simplist way to trade with our Daily Fib Pivot indicator is to treat the Daily Fibonacci Levels as key levels of support and resistance, and trade them with the Break Hook and Go technique.
Wait for a level to hold or break/retest, and that provides your risk on/off level.
If the chart is bearish and you are looking to take a Short Position, then enter on the retest from below of the level, and place a stop just above it.
If the chart is bullish, and you are looking to open a Long Position and you can see more potential upside, then wait for the level to break, and enter on a retest with your stop just below the level.
Never enter a trade for just one reason alone. I usually go for a minimum of three areas of confluence to increase chances of success.
So in the above example, you have the following reason to enter:
- Reason 1: Break Hook and Go off a key Daily Fib Level.
- Reason 2: A Bullish/Bearish trend (EMAs or Higher Highs and Higher Lows) in the direction of your trade.
- Reason 3: To add more conviction to a trade, having an EMA retest along with the Daily Fib Level would make this an A+ setup. If this is the 21EMA, it would be similar to a Golden Goose Strategy. If the retest is with the 30EMA, then it would be similar to a Peaky Blinders Strategy
Once you have entered the trade (and assuming you havent stopped out already), you can start to move your stops up as we approach the next key fib levels. You can either trim your position as we hit those levels, or keep a tight stop near it in case we find major resistance there.

LATEST POST

- Post By CashMoneyTrades
- Jan 11, 2023
How To Trade with Bollinger Bands
- Post By CashMoneyTrades
- Dec 03, 2022
How To Gamify Your Trading: Tips and Strategies for Adding Fun and Excitement to Your Trading Routine

- Post By CashMoneyTrades
- Dec 03, 2022