
The Golden Pocket is the area between the 61.8% and 65% Fibonacci Retracement.
I highly recommend learning about Fibonacci Numbers.
One of the things you will learn is the 0.618 is known as the “Golden Ratio”. Thus, we call this trading strategy the “Golden Pocket” as we are looking for a retrace to the 0.618 level.
The Cash+ Golden Pocket Indicator
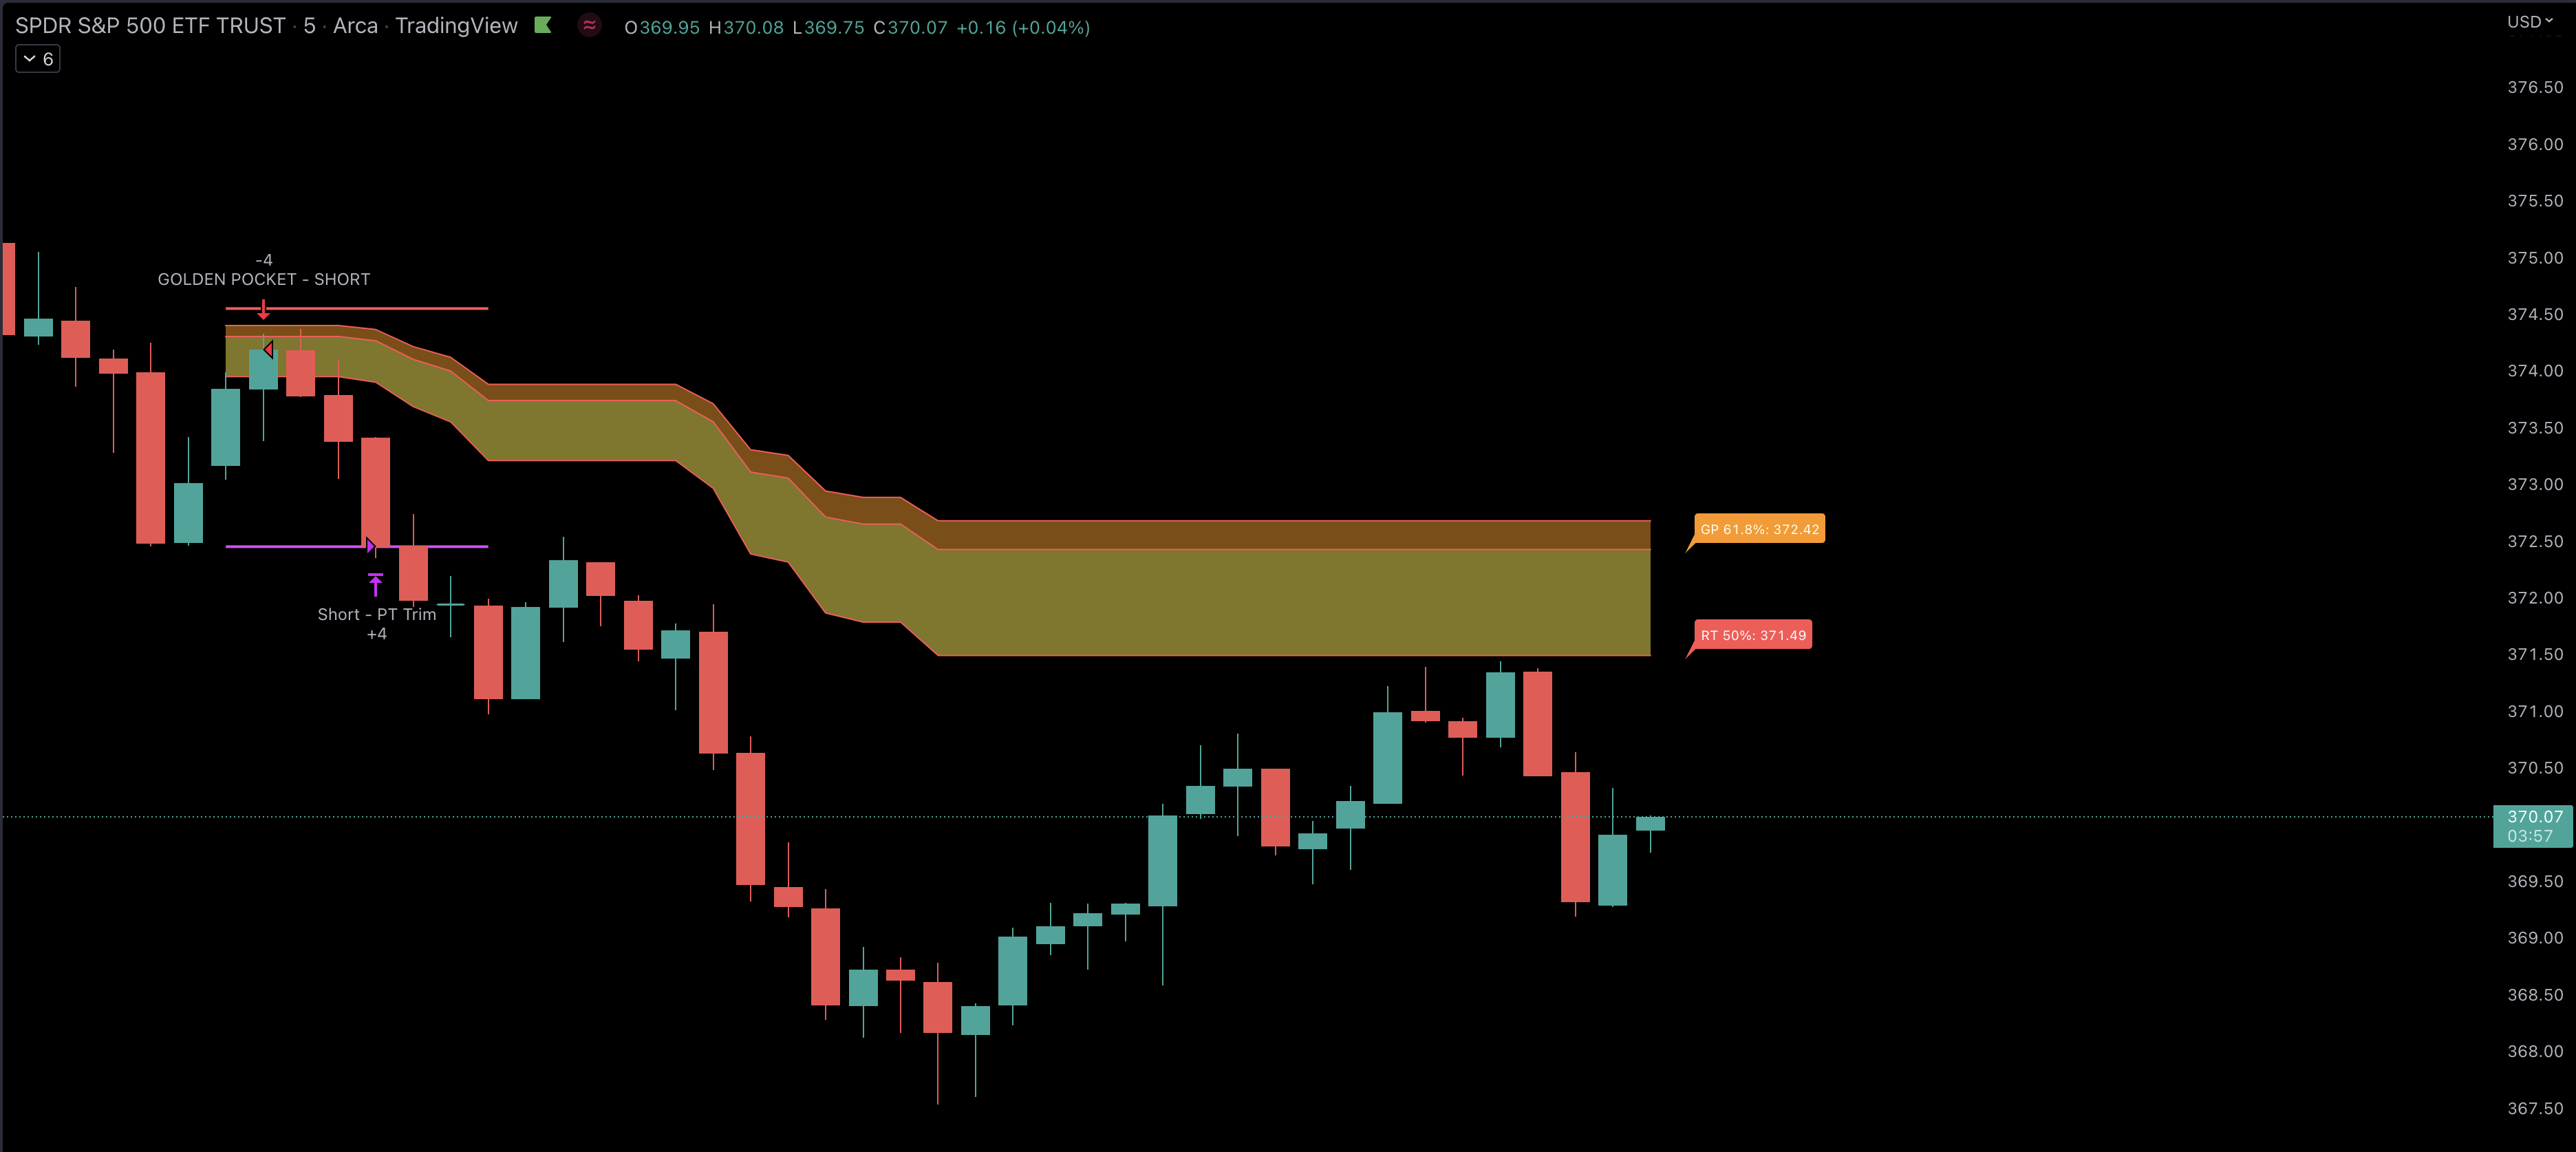
Chart of 5m $SPY on October 18, 2022. You can see an initial retrace to the 0.618 level, which is an signal to Go Short. Later in the day, we come back up and retrace to the 0.50 level before rejecting again.
The Cash+ Golden Pocket Indicator will automatically plot the Golden Pocket on your chart, starting at 10am ET. It will automatically calculate the 0.618 - 0.65 area based on the current days high and low, as well as the wider 0.5 area, and display them on the chart. The strategy can also help alert high probability entries based on retests of the Golden Pocket.
How to Trade The Golden Pocket Strategy
As with all things trading, nothing is ever always exact, thus you add positions using this strategy is in that 0.618 - 0.65 pocket, with a stop over the 0.65 level. This allows us to enter a trade with defined risk with great risk to reward ratio. You know exactly where to stop out, and it will usually be very close to your entry.
It is very easy to trade the Golden Pocket strategy.
STEP 1. Let the market settle down for the first 15-30 minutes so that a trend can develop.
STEP 2. The Cash+ Golden Pocket Indicator will start plotting the Golden Pocket on the chart after 10am.
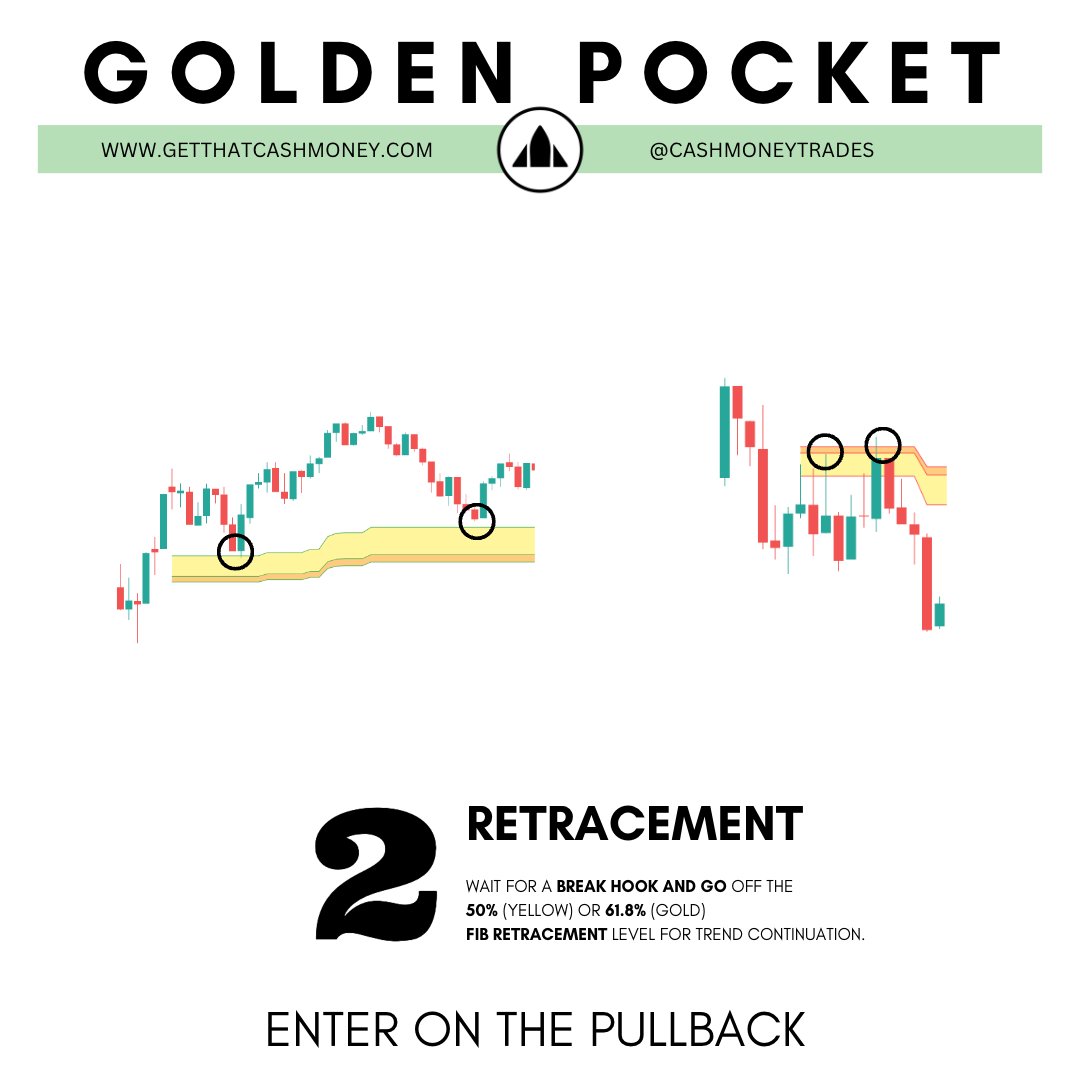
STEP 3. Once we have a move in one direction, price action will eventually pullback. This is where you need to be patient and wait for a retrace to the 0.618 Golden Pocket level. At this point you are looking to buy a position at a discount while the trend stays in tact.
STEP 4. Once we retest the 0.618 level, you can now enter a LONG or SHORT position based on the direction of the bounce. You should place a stop loss just below the 0.65 level. You may choose to add to your position between the 0.618 and 0.65 levels as we may wick in that range. A close over 0.65 should signal you to stop out of your trade.
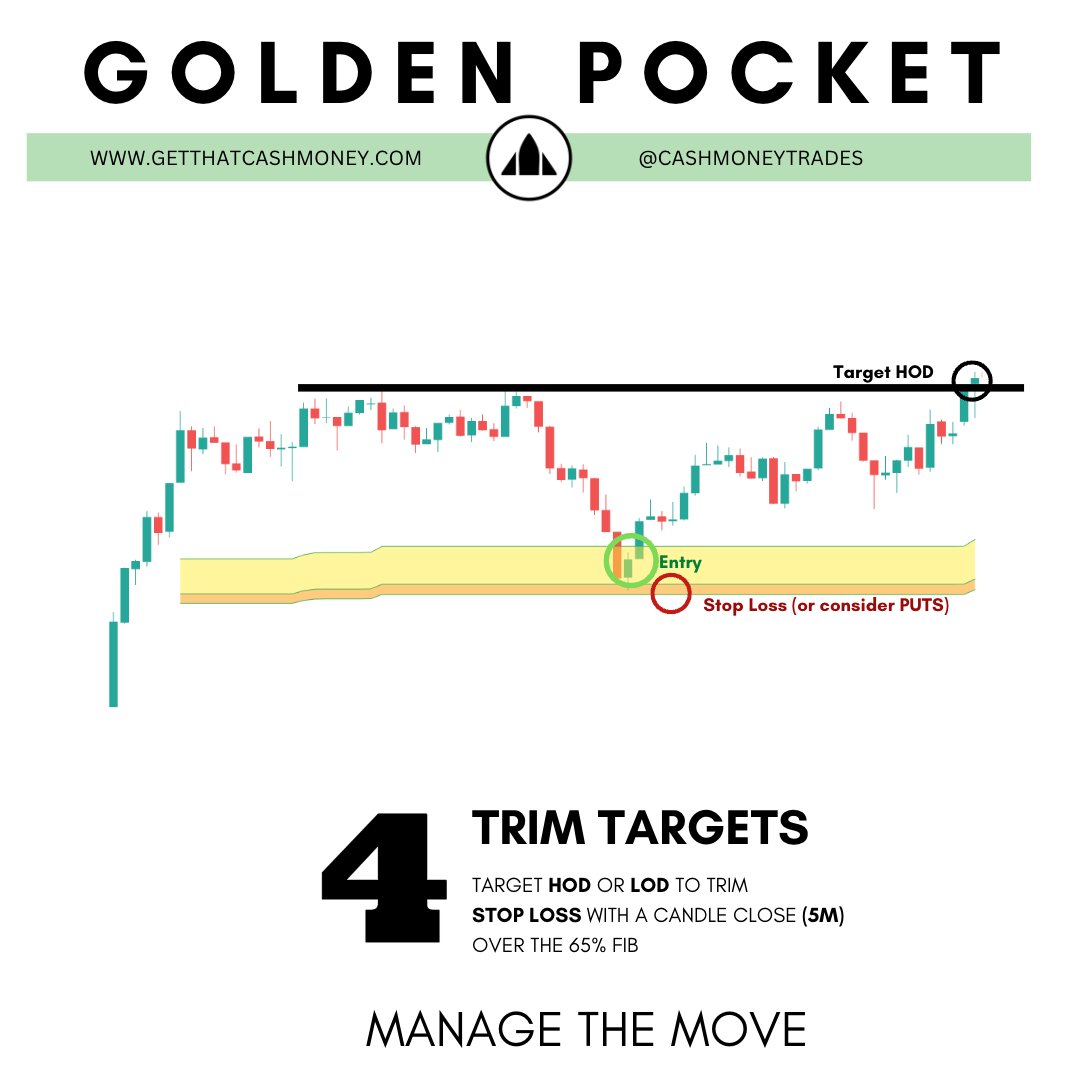
STEP 5. As the chart moves in your favor after the retest, you can take profits as you see fit, look for trims at HOD/LOD, or simply continue to move your stops to ensure profits. But don’t let a green trade go red! After an initial move down, its always wise to move your stop to break even.
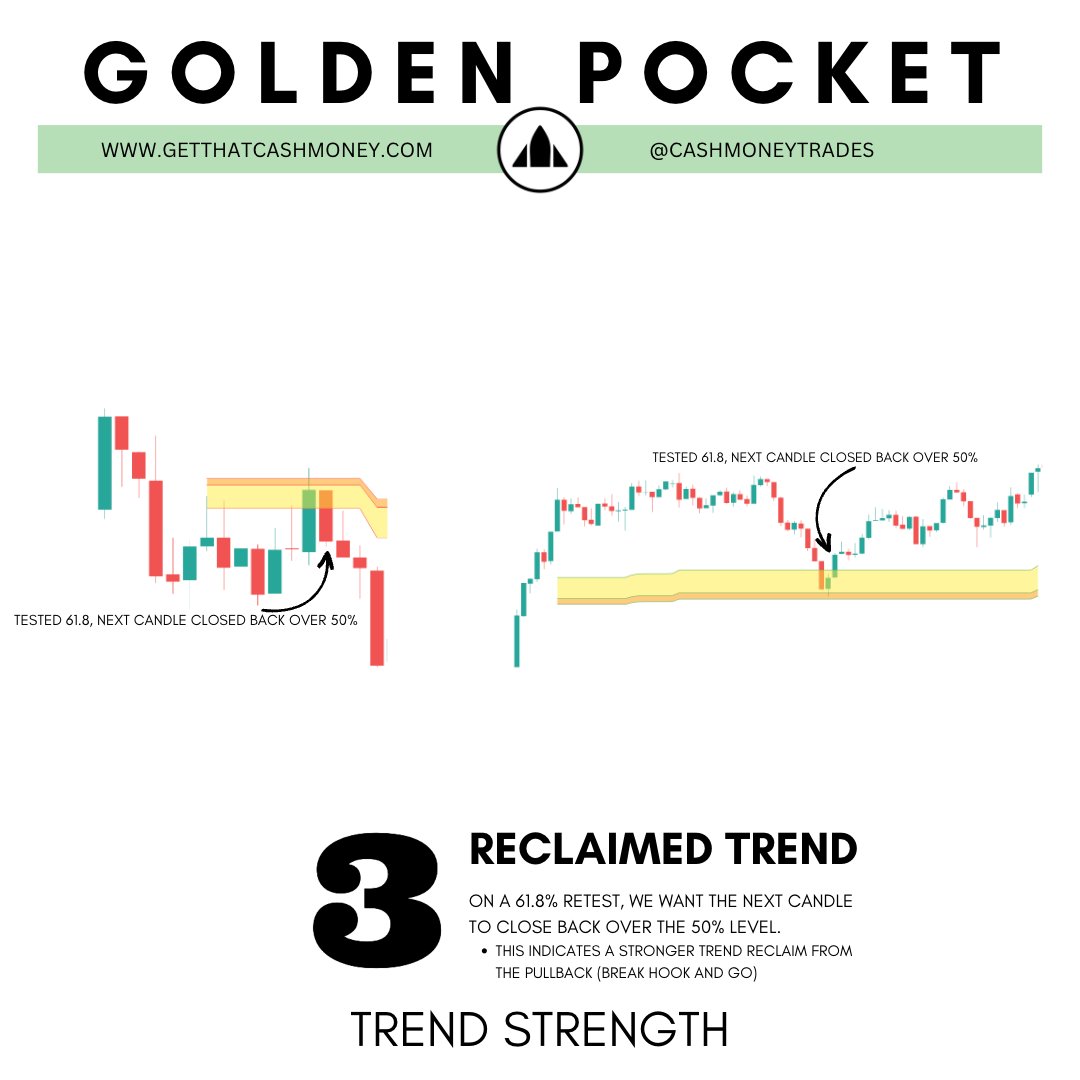
The strongest moves have happened when we close back over the 50% retracement line on the next candle after we retest the 0.618 level.
If we end up closing inside the Golden Zone (between the 0.5 and 0.618 region), then its a sign of momentum dying and the trade loses its strength.
STEP 6. On a trending day, you want to stay in the trade as long as possible, and let the market take you out via stops placed just above key levels once crossed. You should trim all remaining positions if we retrace back over the 0.5 level as at that point the strategy is invalidated.
CHART SETUP
DETERMINE ENTRY
TREND STRENGTH
MANAGE THE MOVE


LATEST POST

- Post By CashMoneyTrades
- Jan 11, 2023
How To Trade with Bollinger Bands

- Post By CashMoneyTrades
- Dec 03, 2022
How To Gamify Your Trading: Tips and Strategies for Adding Fun and Excitement to Your Trading Routine

- Post By CashMoneyTrades
- Dec 03, 2022