
The Opening Range Breakout (ORB)) is a commonly used strategy where levels of support and resistance for the day are determined from the opening period. The direction for the day is often set at the opening bell - whether it is an uptrend or downtrend day.
I usually use the 15 minute ORB (uses the High and Low from the first 15 minutes of the regular session 930am - 945am ET), but there are others who have successfully traded with a 5 minute ORB or even a 30 minute ORB strategy.
What we have found is that the price of a security will tend to retest and bounce and breakout from these opening highs and lows. You can take advantage of that price action by setting those levels on your charting software and triggering Calls or Puts when those levels cross with volume or are retested.
Whats more, the 50% and 100% levels from the ORB range also tend to attract the price and become S/R levels themselves. This gives you a good Profit Target area to guide when you should exit an options contract.
The Cash+ ORB Indicator
If you use TradingView, you can integrate my free ORB indicator directly into your charts. The Cash+ ORB Indicator will automatically plot the high and low opening range lines (optionally shaded), and plot the Price Targets.
There is also a premium version of the Cash+ ORB Indicator reserved for subscribers. The premium version contains fib based price targets and smarter alerts for entries. The premium version is also implemented as a strategy so you can backtest the results in TradingView.
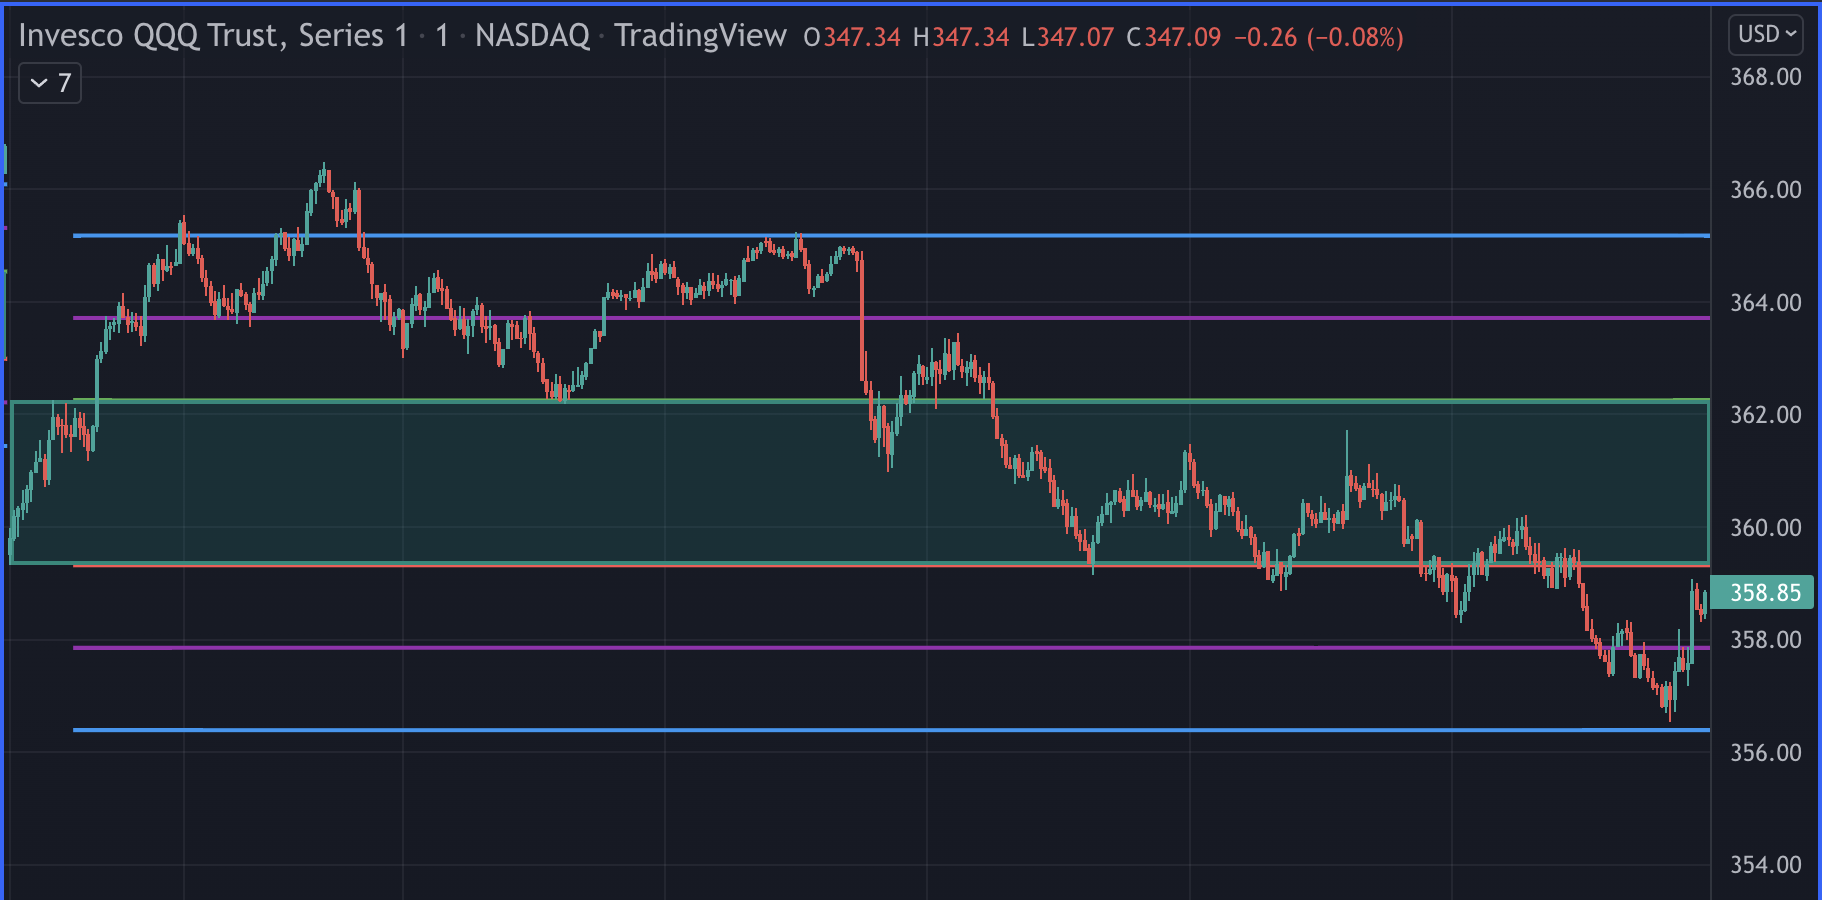
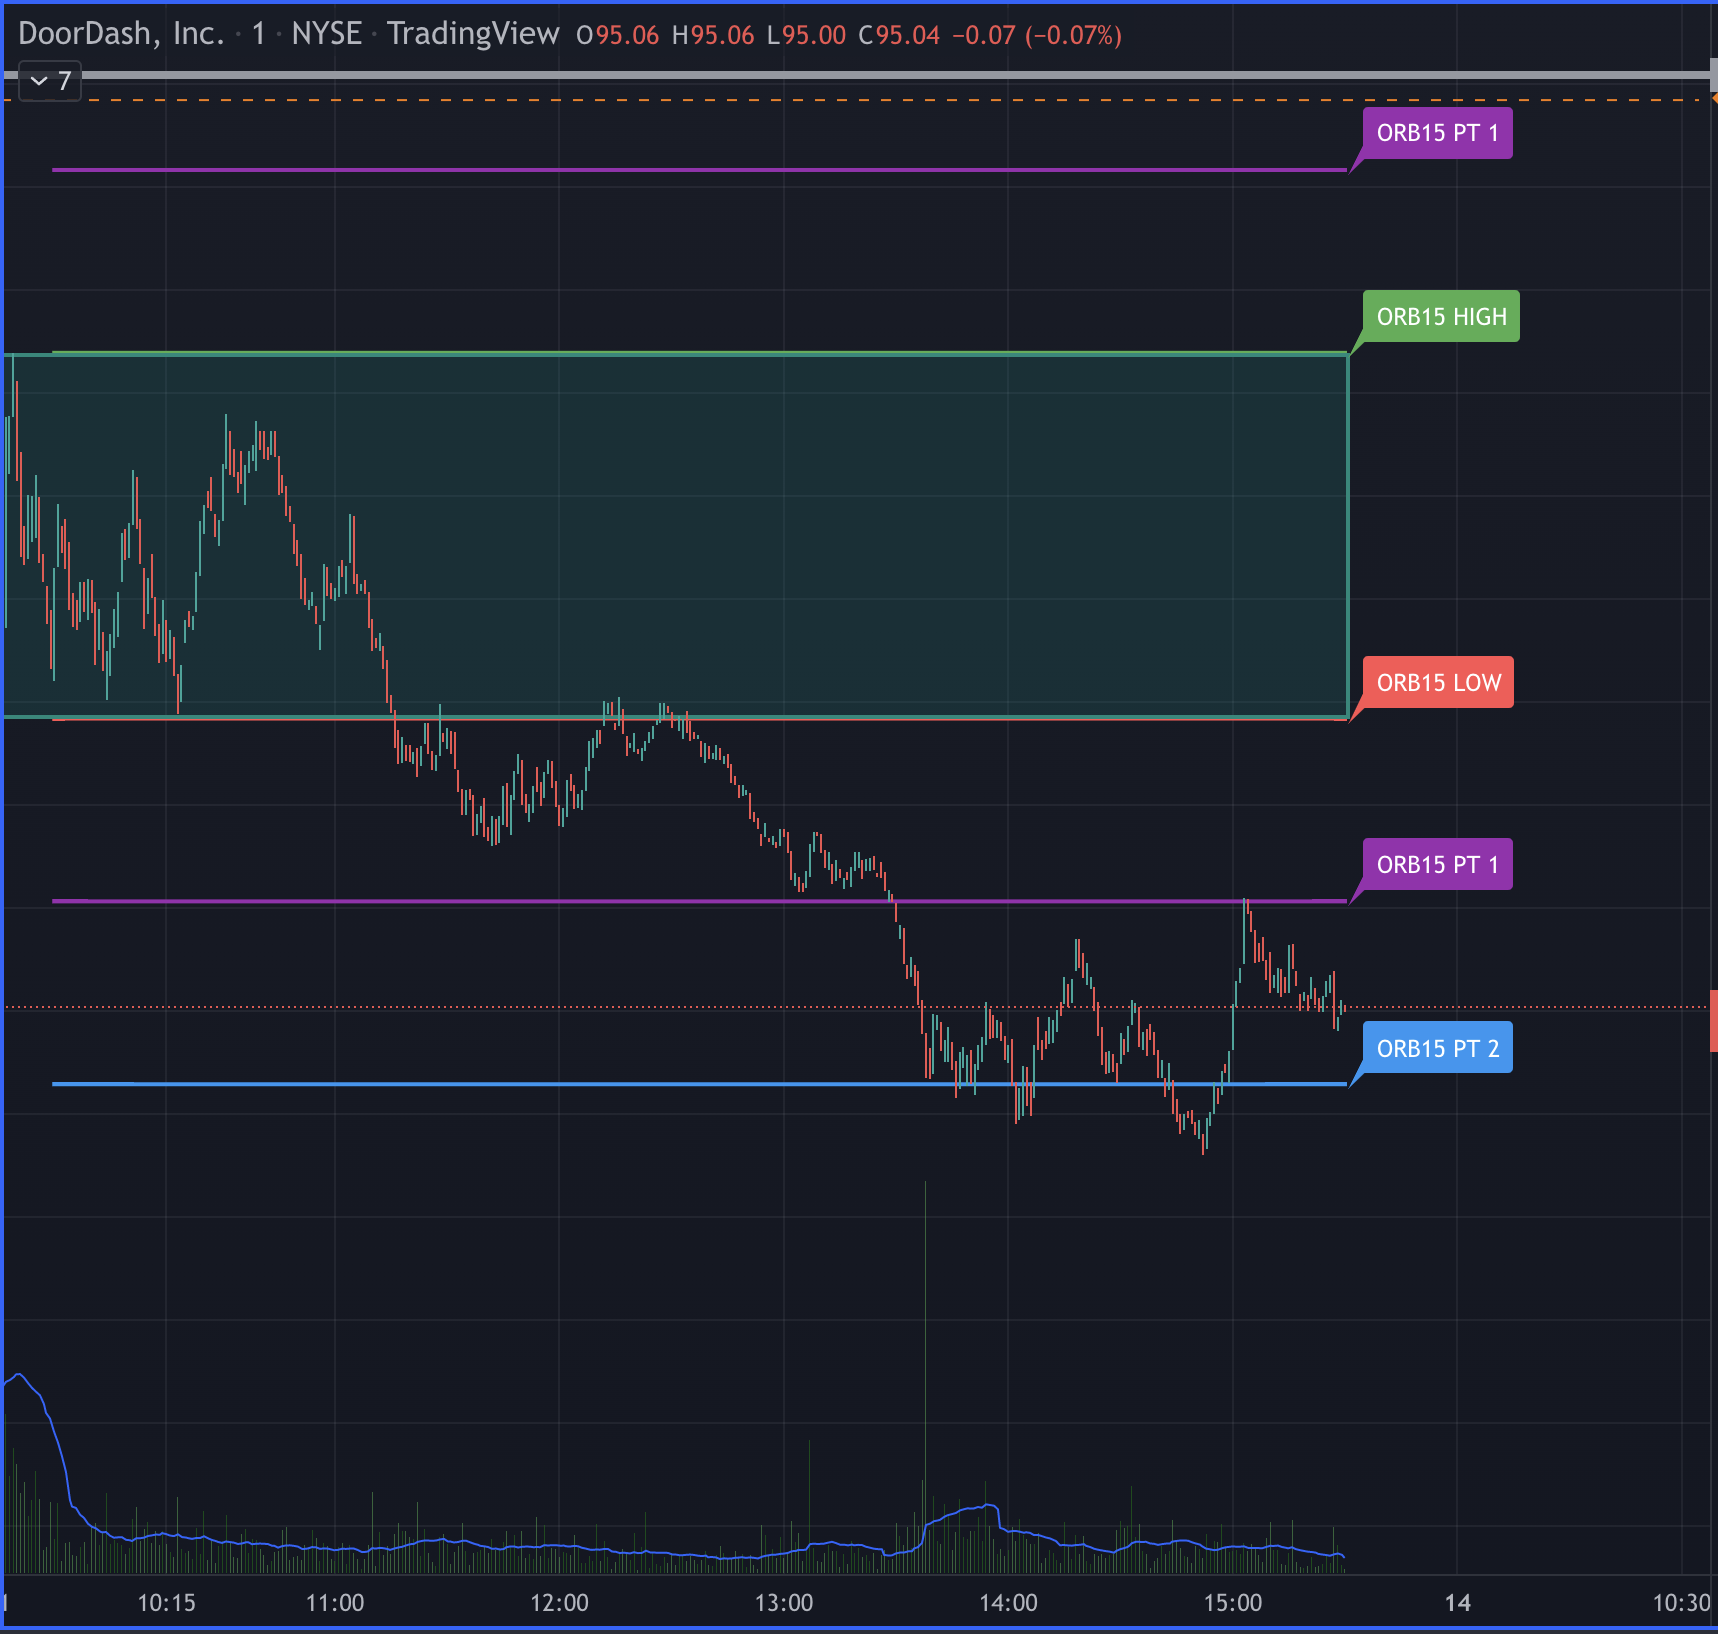
Here are some examples of where ORB levels have played out beautifully.
$QQQ (Feb 10, 2022)
$DASH (Feb 10, 2022)
How to Trade the Opening Range
In these examples, I will be referring to the 15 minute opening range. But you can apply these same principles to any of the other time ranges (5min, 15min, 30min).
To trade the Opening Range Breakout strategy, you want to allow the market to settle down for the first 15 minutes. You will often get a lot of volatility at the open, so this allows you to sit out the craziness of the opening bell and let the direction work itself out. Once the first 15 minutes are up, game on.
You can trade the ORB strategy on any timeframe, but I recommend the 1m, 3m, or 5m. The 3m or 5m helps avoid the fakeouts a bit more in my opinion. Whichever timeframe you choose, you want to make sure your confirmation is a candle close over the ORB level and then enter on the retest with a stop on a cndle close below the level. See the Break Hook and Go technique.
There are two ways to play the Opening Range breakout.
1. Break with Volume
Look for a break of the opening range level (lets say the high of the opening range in this example). You want the level to break with significant relative volume, supported with the price action of the underlying stock. If you have a strong break of the level, you can enter a CALL position at this time. This can be considered riskier as if the volume doesnt continue, the price could move against you. If you do enter on a break with volume, you want to ensure you have a suitable Stop Loss in place - usually just below the ORB High level - so you can minimize losses if it moves against you.
2. Wait for a Retest Bounce
A safer approach is to wait for a retest after the initial breakout, and confirmation of a bounce (aka Break Hook and Go). After the initial break, often the stock will retrace to the ORB High level (in the case of bullish direction). You can enter on the retest and hold of that ORB High level, with a Stop Loss just below the ORB High.
This approach allows you to stop out with minimal losses if the ORB High level does not hold. We have often seen retests like these propel a stock to new daily highs.
If the neckline for the retest was pretty close to the ORB level, then you can be safer more by waiting for that neckline to break.
In both of these scenarios, it is critical to ensure the volume is telling the story. If there is a lack of volume to push the stock higher, then its likely to not carry to new highs.
How to identify Strong Breakouts
A strong breakout or retest can be identified by looking at the volume on the current candle. If you have a breakout but the relative volume is low, chances of the price holding also becomes low as few buyers are pushing the price.
Likewise, you may get high volume, but the candle results in a doji - meaning both buyers and sellers came in with volume, but were unable to shift the price. This would be considered a weak breakout.
However, if you get large price candles moving in your direction with the relatively high volume coming in, then that is considered a strong breakout and price is likely to continue as buyers are stepping up.
Candle Wicks vs Close over an ORB level
Just because a candle wicks above your ORB High level, you should NOT consider that as a break. The candle needs to close above the level, and then continue with the next candle as confirmation of the move. The last thing you want is for the candle to wick above your level, only to be rejected back down. A closed candle has higher conviction that the level will hold.
How to Short with ORB
The Opening Range Breakout is not just for CALLS. In the examples above I referenced the ORB High level and getting into CALLs above that level. Likewise, the ORB Low level can be used to allow you to play PUTs. The advantage of this is you dont need to hold a market bias going into a trade. If its below the ORB Low level, and the market is looking weak, then its a good indicator to short the stock by buying PUTs.
What other indicators work well with ORB
I will usually overlay the 34 ema (on the 1m chart) or 9ema (on the 5m chart) and VWAP alongside the ORB indicator. The 9ema is great to use as support when in CALLs and as resistance when in PUTs. If getting into CALLs and price is below the 9ema (5m chart), then its a no entry sign. Likewise VWAP should also support your trade as another level of support/resistance. A really powerful combination is also when the break of the ORB level coincides with the 9ema on the 5min chart. That provides an A+ setup with multiple factors setting up a higher conviction trade.
When to Exit the trade
The ORB indicator for Trading View will give you price targets based on the 50% and 100% of the opening range. Price tends to reflect these levels and so are good profit target areas to start trimming your position. Likewise the 34ema is another great moving average to keep you in a trade while the price stays above it. You can exit when the price crosses the 34ema. Note though if the stock is going parabolic and starts diverging away from the 34ema, then its a good idea to book the profit so you dont give a lot of it back on its way back to the 34ema.
VIDEOS
Here is a video I made on trading the Opening Range Breakout.
There is another great video from SevenStarMike where I originally learned the ORB strategy. Its worth a watch when learning how to trade ORB. Eventually I will have my own set of videos up showing how I trade ORB.
I will often trade with the ORB strategy, so follow me on Twitter, to get regular updates on how I am using the ORB to guide my trades.

LATEST POST

- Post By CashMoneyTrades
- Jan 11, 2023
How To Trade with Bollinger Bands

- Post By CashMoneyTrades
- Dec 03, 2022
How To Gamify Your Trading: Tips and Strategies for Adding Fun and Excitement to Your Trading Routine

- Post By CashMoneyTrades
- Dec 03, 2022