
The System Strategy is trading based on the 10 SMA and 50 SMA crossover on the higher timeframe 30min and hourly charts.
It was created by @TraderBJones.
Regardless of your trading style, The System allows you to have a slighly higher macro direction in mind while you trade on your shorter 5m or 1m timeframes. When all timeframes line up in direction,
How to Trade The System Strategy
BUY/SELL SIGNAL - 10/50 SMA CROSSOVERS
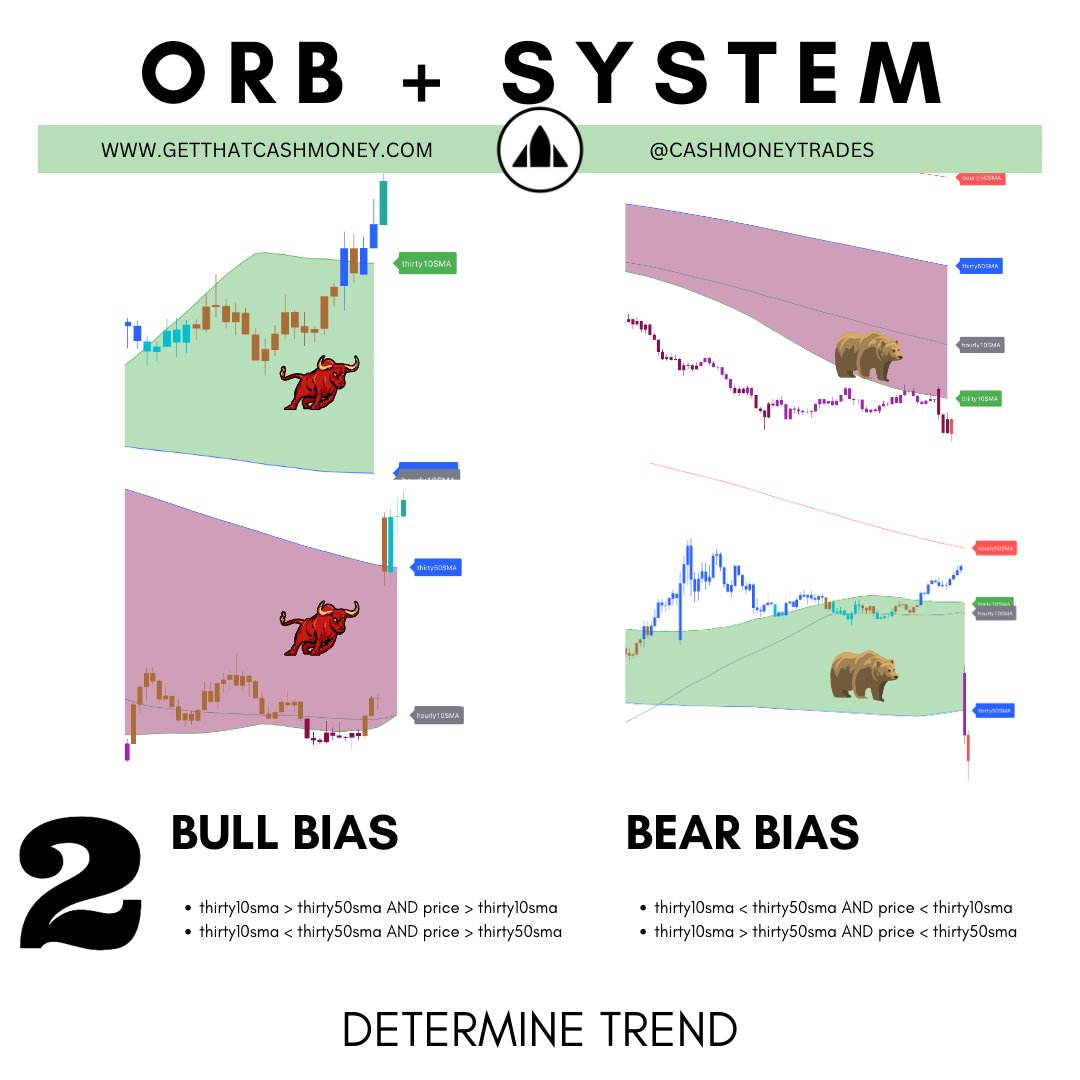
If the 10/50 SMA is bearish on the 30m chart, you have a SHORT thirty signal. If bullish, you have a LONG signal.
If the 10/50 SMA is bearish on the hourly chart, you have a SHORT hourly signal. If bullish, you have a LONG signal.
As these are based on longer timeframes, once you get The Signal, you want to find optimal entries on the shorter time frame charts to base your entries in the direction of the larger timeframe trend.
THE CHOP ZONE
If price is trading between the 10SMA and 50SMA levels on the 30min chart, then this is considered a chop zone, and trades should be avoided or sized much smaller as direction is uncertain.
CONVICTION
The strongest signals are when both the 30m and hourly charts are telling the same story.
GETTING OVER EXTENDED
Once we get a 100 point move in our direction away from the 50 SMA, we are consided in extended territory and expect pullbacks. While we still have LONG signal, you may consider buying these dips until the trend changes again.
THE REVERSAL
If we currently are in a BUY signal, but the price action breaks below the 50 SMA, then you have an indication of the bears regaining control. This will bring the SMA’s back together and create an eventual SELL signal. You can trade to get ahead of the official SELL signal by trading a SHORT position when we break the 50 SMA on the 30m chart.
The opposite can be played in the inverse setup, where we may have a SELL signal, but then go LONG if we break through and start trading above the 50 SMA.
Once we get the reversal into the 50SMA, we should start to buy/sell the pullbacks in anticipation of the EMA crossover occurring and a new signal being announced.
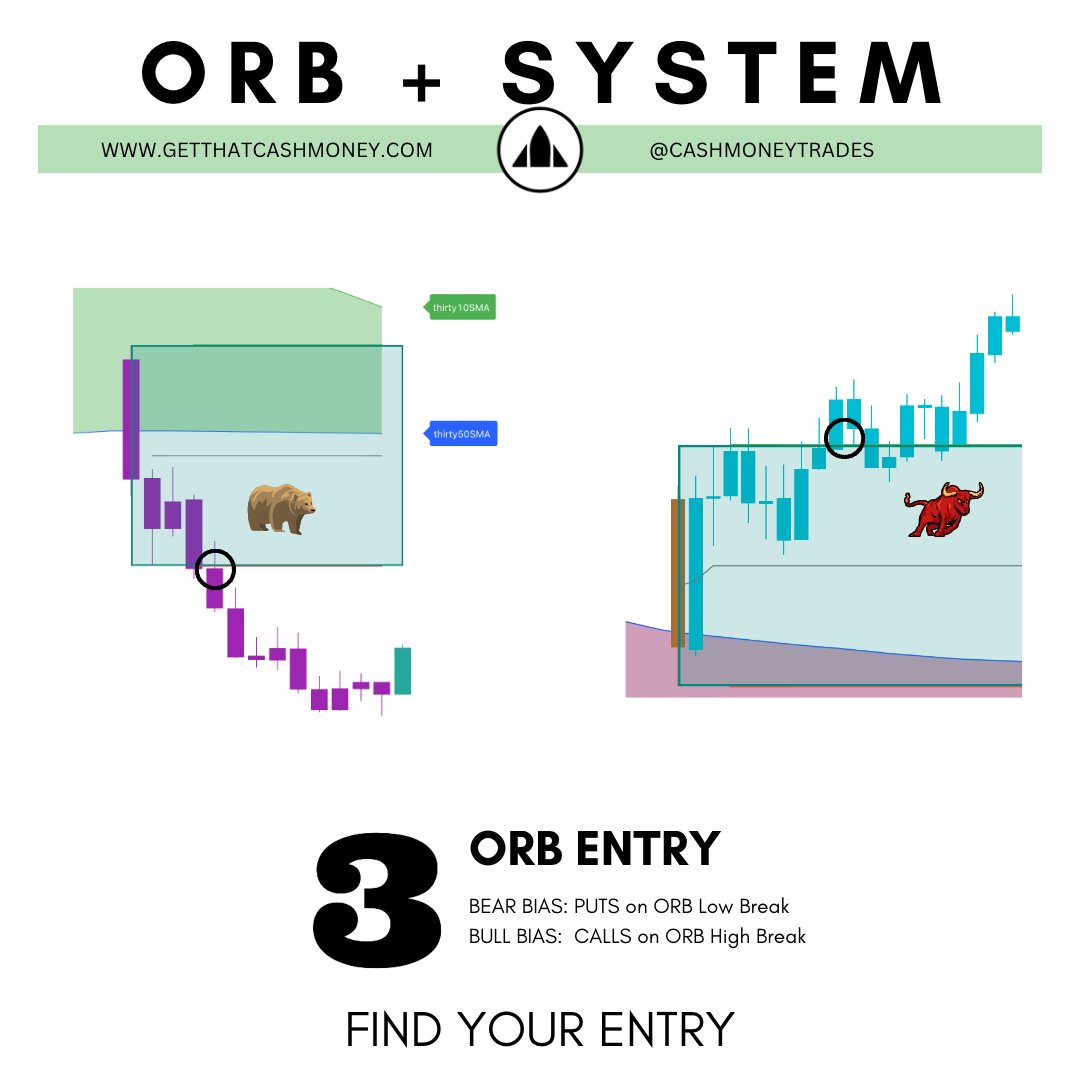
SORBET - THE SYSTEM + ORB ENTRY POINTS
This strategy combines my two favorite techniques - ORB and The System. Learn more about the Opening Range Breakout strategy to find Entries and Exits. By combining these two strategies, you can reduce the amount of fakeouts by determine the larger timeframe bias given by The System, with optimal day trading entries and exits using ORB.
I also have the most comprehensive back testing for the ORB + System strategy. You can review every trading day over at my Daily Recaps page to review where the entries/exits were based on this strategy and how I traded it.
CHART SETUP
DETERMINE TREND
FIND YOUR ENTRY
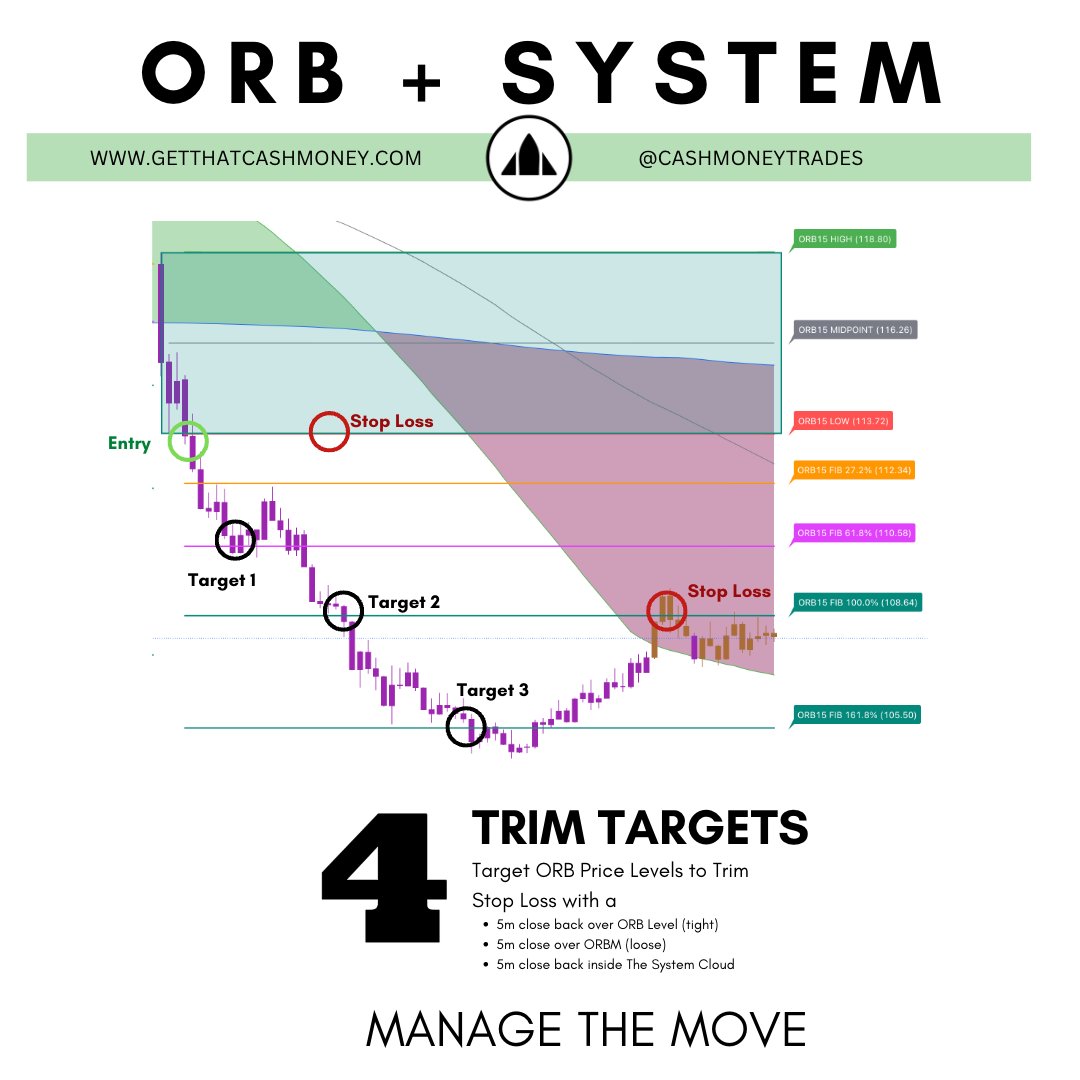
MANAGE THE MOVE

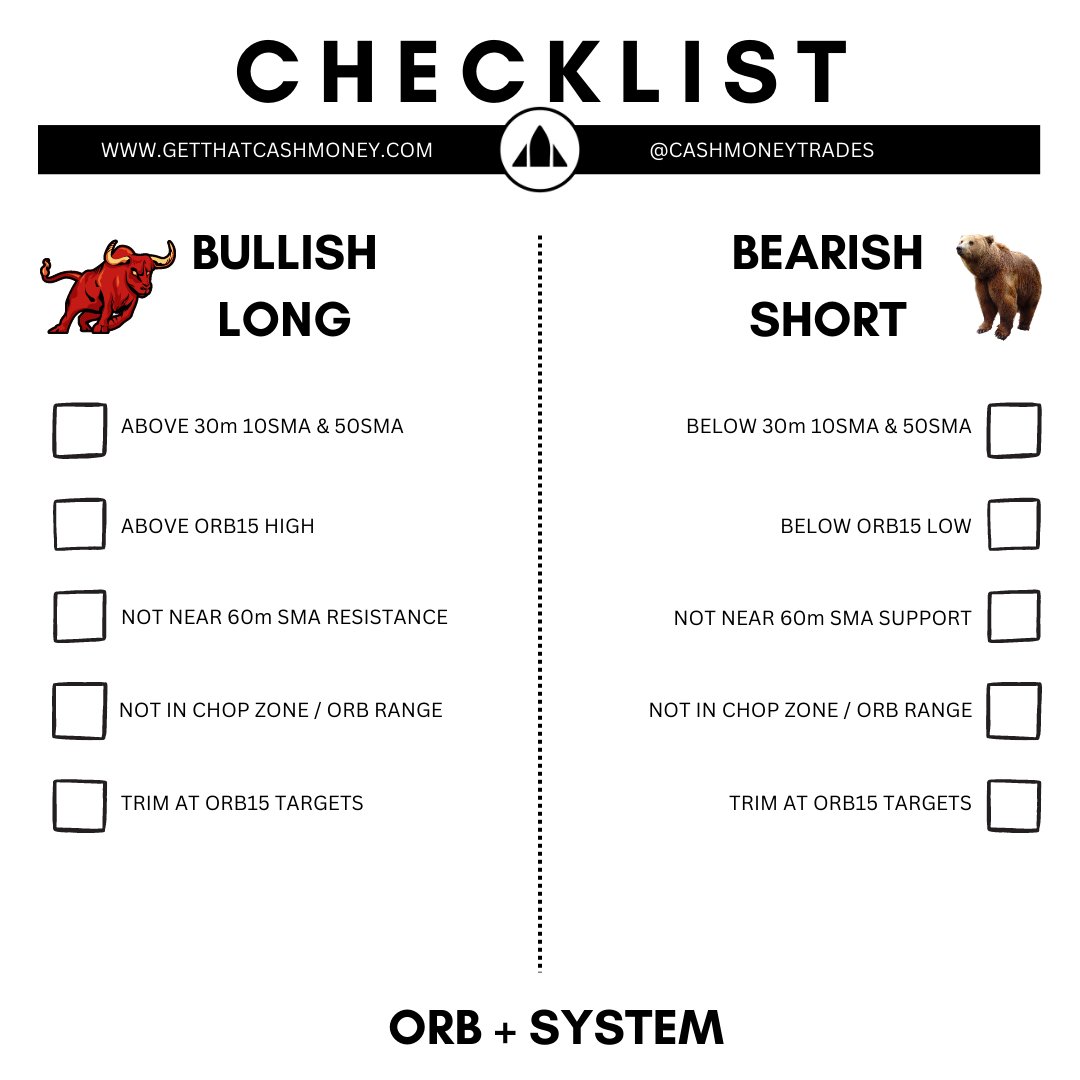
FREE ORB+SYSTEM CHECKLIST
MORE EDUCATION
Please start by learning from the original document on The System below, taught free by its creator TraderBJones
Watch how we nailed TSLA puts in December using The System
TRADE THE SYSTEM WITH US - SPYDER ACADEMY
I trade live everyday alongside an amazing group of traders. Many of us now use The System in our daily trading process. If you are looking for a great community to trade with, and to refine your skills trading with The System, then look no further than Spyder Academy.
The Cash+ The System Indicator
I have built the first (and currently only) The System TradingView indicator that makes trading The System easier.
If the 10SMA on the 30min chart is trading over the 50sma, then the market is bullish . If the 10SMA is trading under the 50SMA on the 30min chart, then the market is bearish .
CANDLE COLOR CODING
The Cash+ System Indicator colors the candles based on what The System is currently telling us.
- Blue = Strong Bullish - Trading above the 10 SMA and the 10 SMA > 50 SMA giving a BUY signal.
- Aqua = Mild Bullish - Trading above the 50 SMA, but we do not have a BUY signal yet. MACD is bullish.
- Amber = Uncertainty in the market. Trading is in a chop zone, and trades in this area are high risk.
- Pink = Mild Bearish - Trading below the 50 SMA, but we do not have a SELL signal yet. MACD is bearish.
- Purple = Strong Bearish - Trading below the 10 SMA, and the 10 SMA < 50 SMA giving a SELL signal.
Along with the colored candlesticks , the indicator will signal when to go LONG or SHORT based on when the trend direction changes.
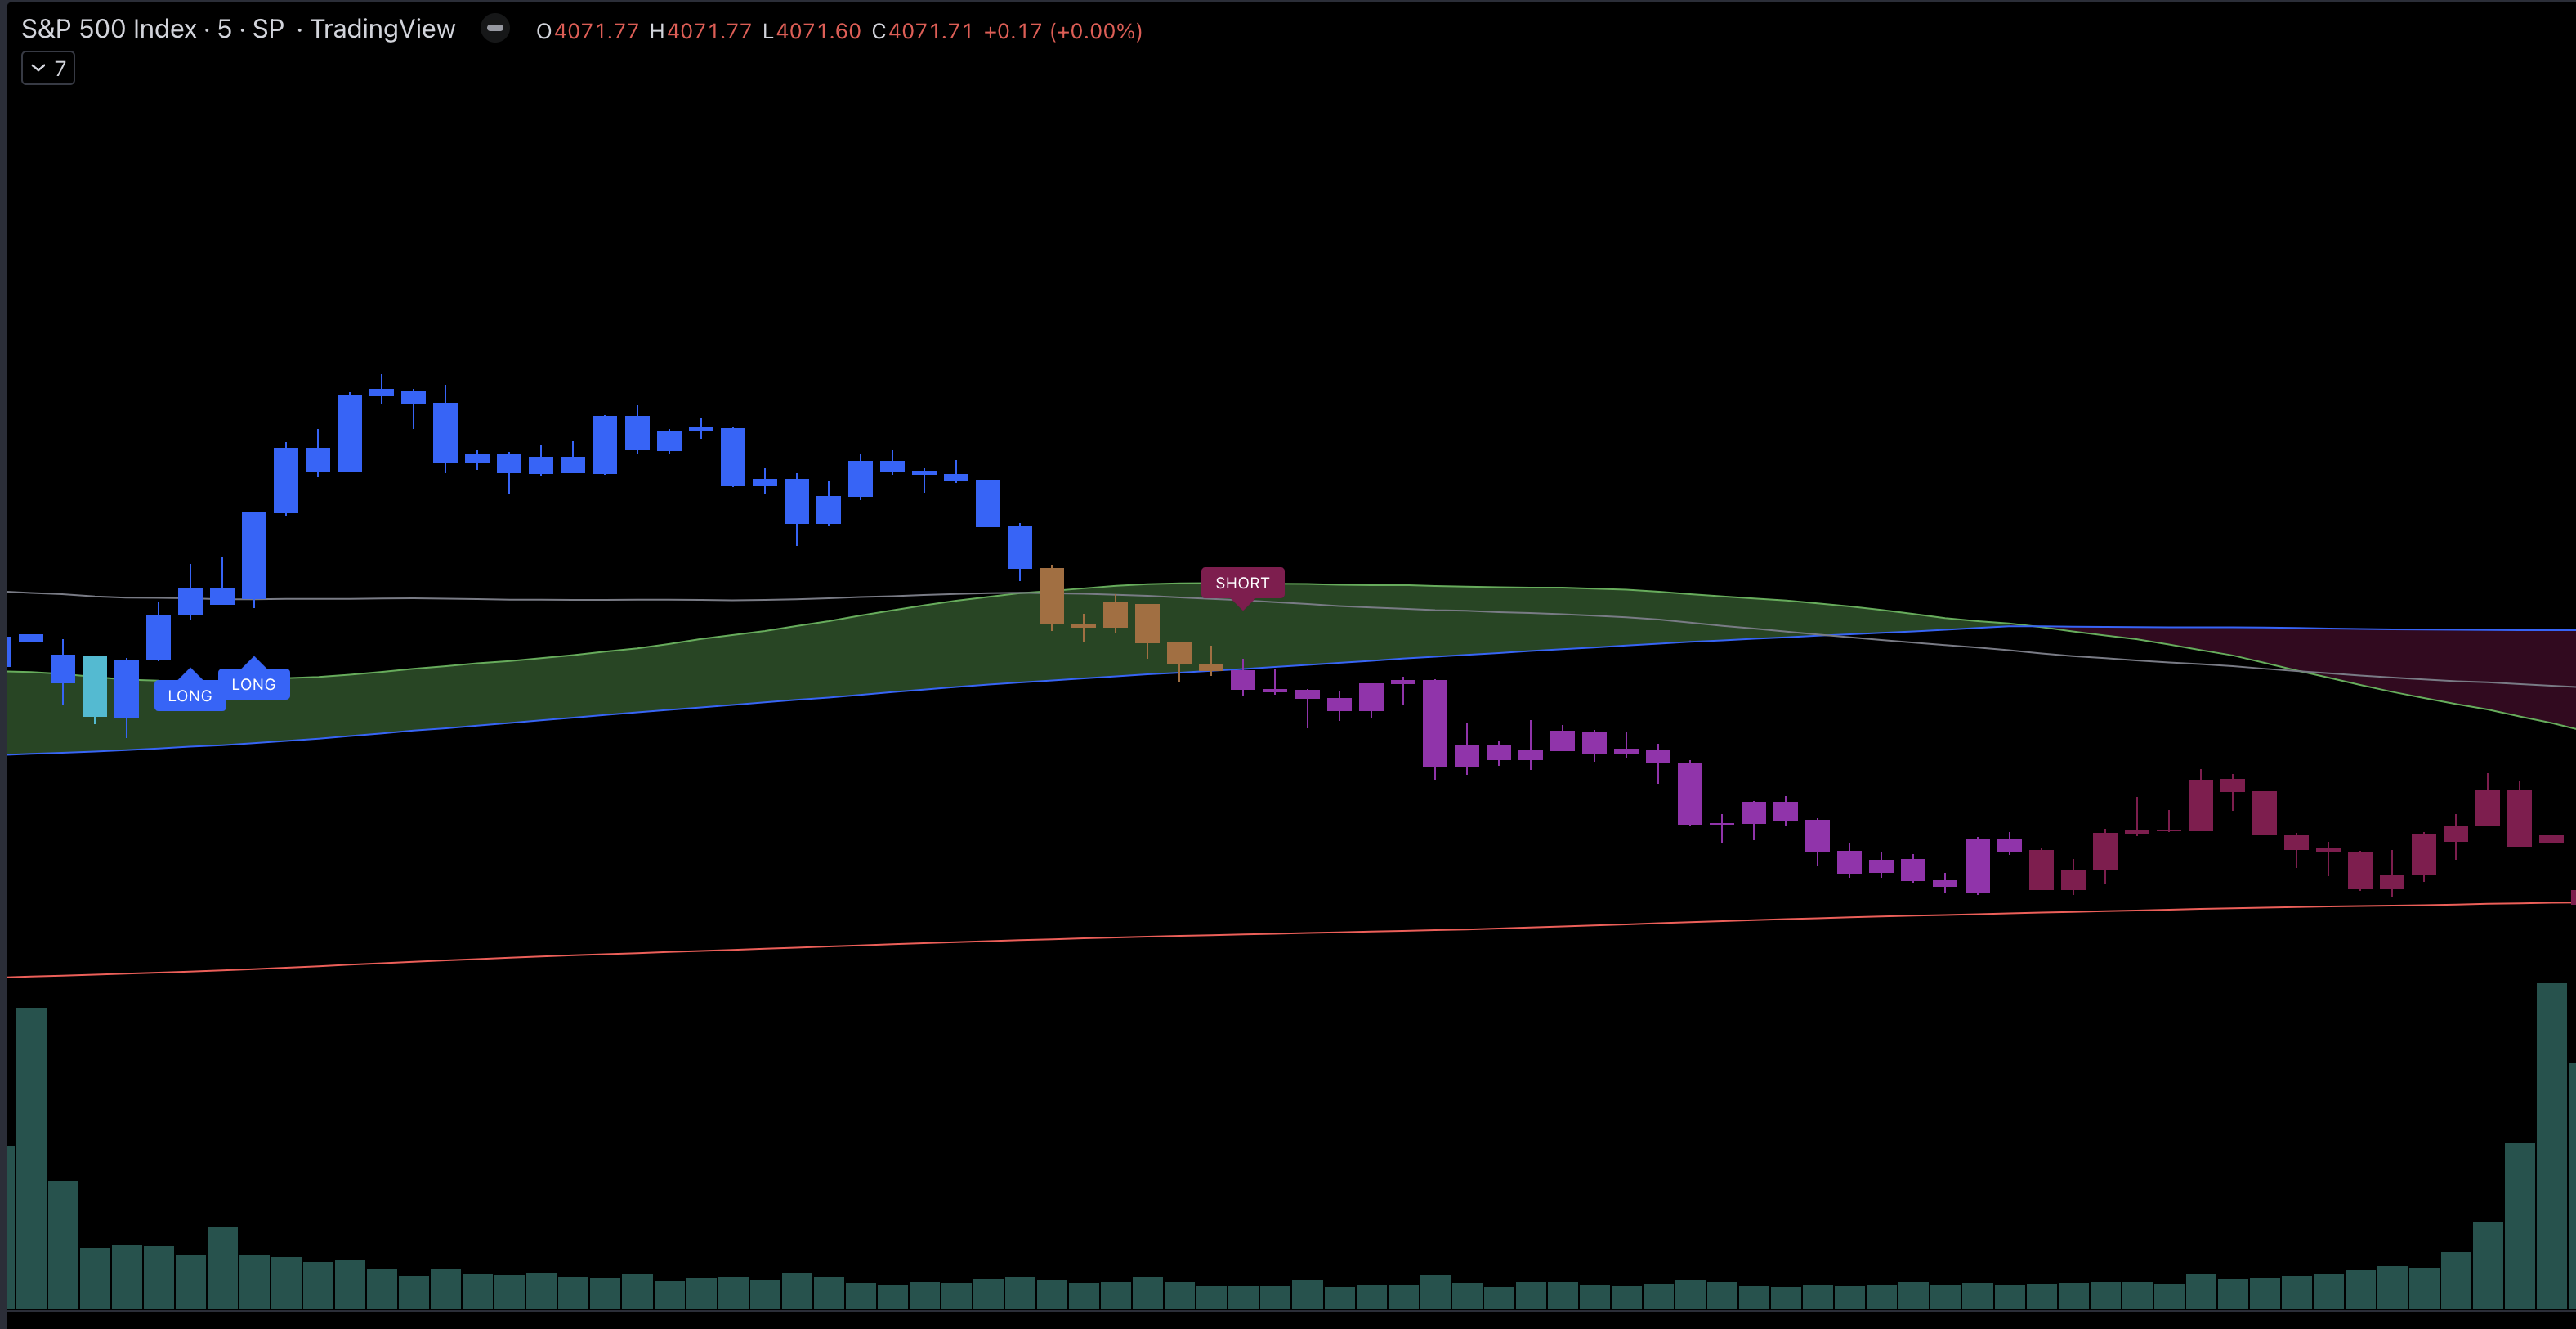
Chart of $SPX 5m with the Cash+ System Indicator on October 20, 2022.
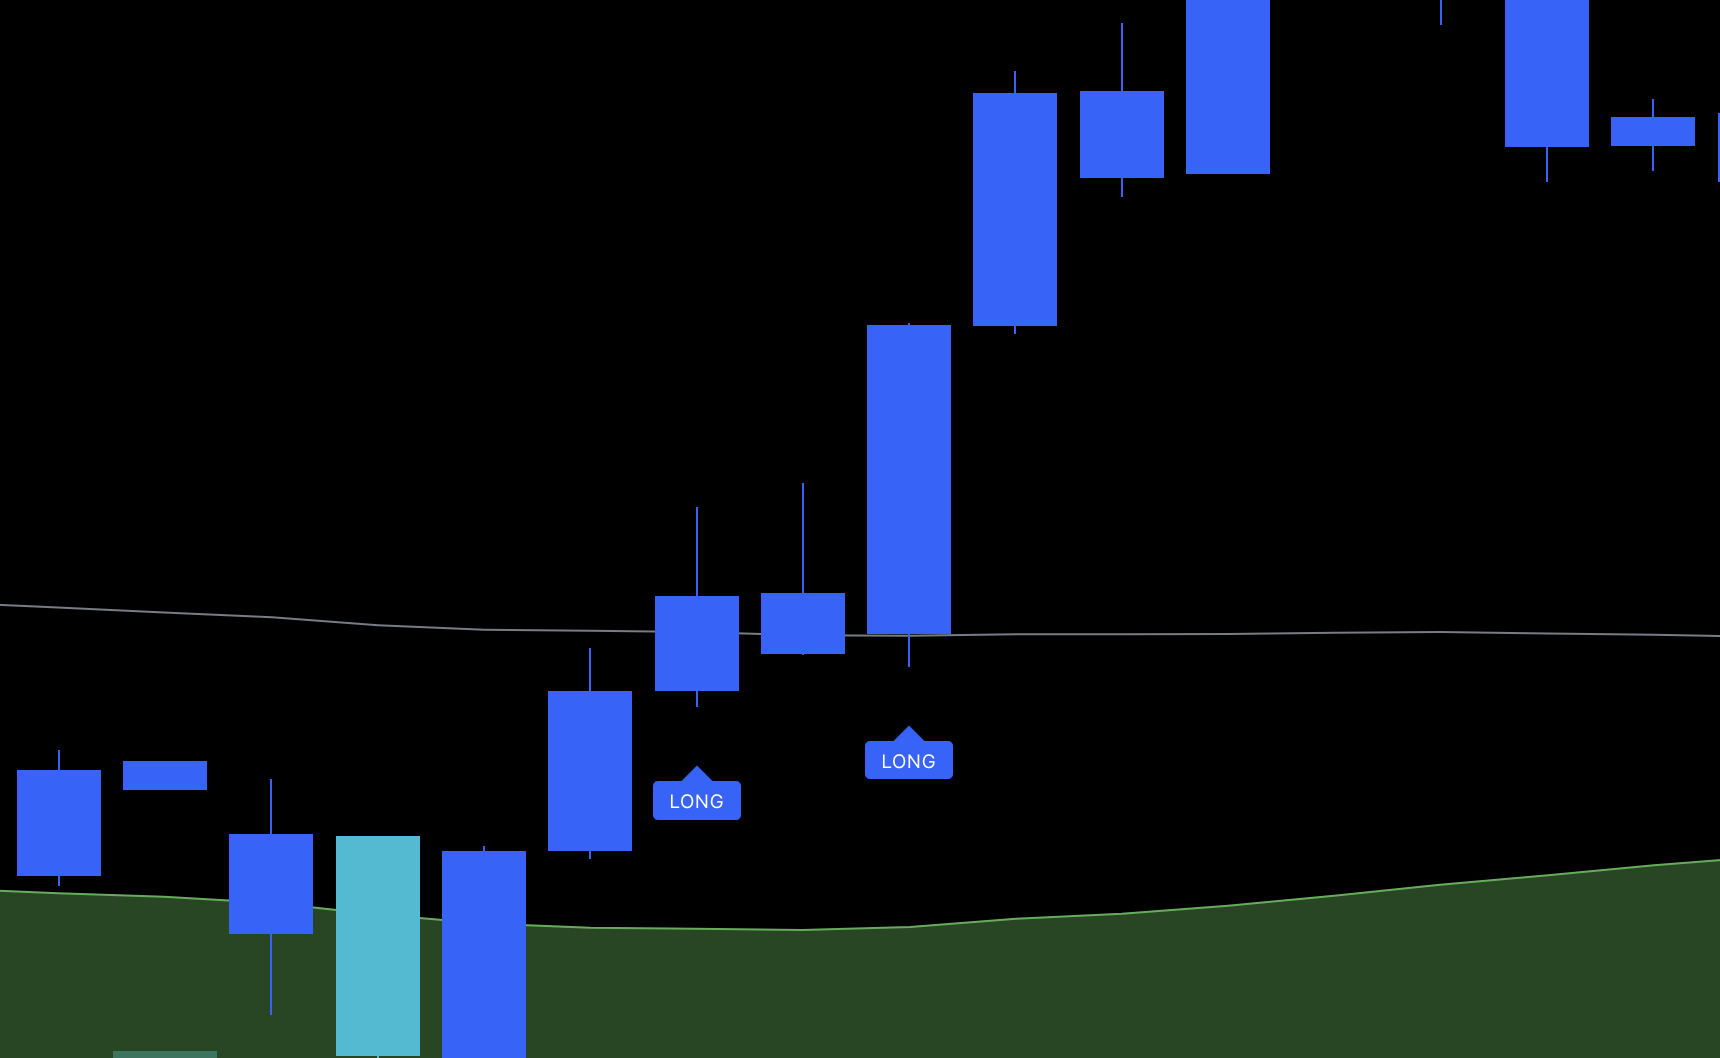
On October 20, 2022 - The System was in a BUY signal on both the hourly and 30m timeframes (hence blue candles) and triggered an alert to go LONG when we crossed ABOVE the 10 SMA on both hourly and 30m charts.
Once SPX 5m whent above the hourly10sma (and we were already above the thirty10sma), we got the alert to go LONG. The Cash+ System Indicator will take profits aggressively, but you can trade your own plan and potentially extract more of the move.
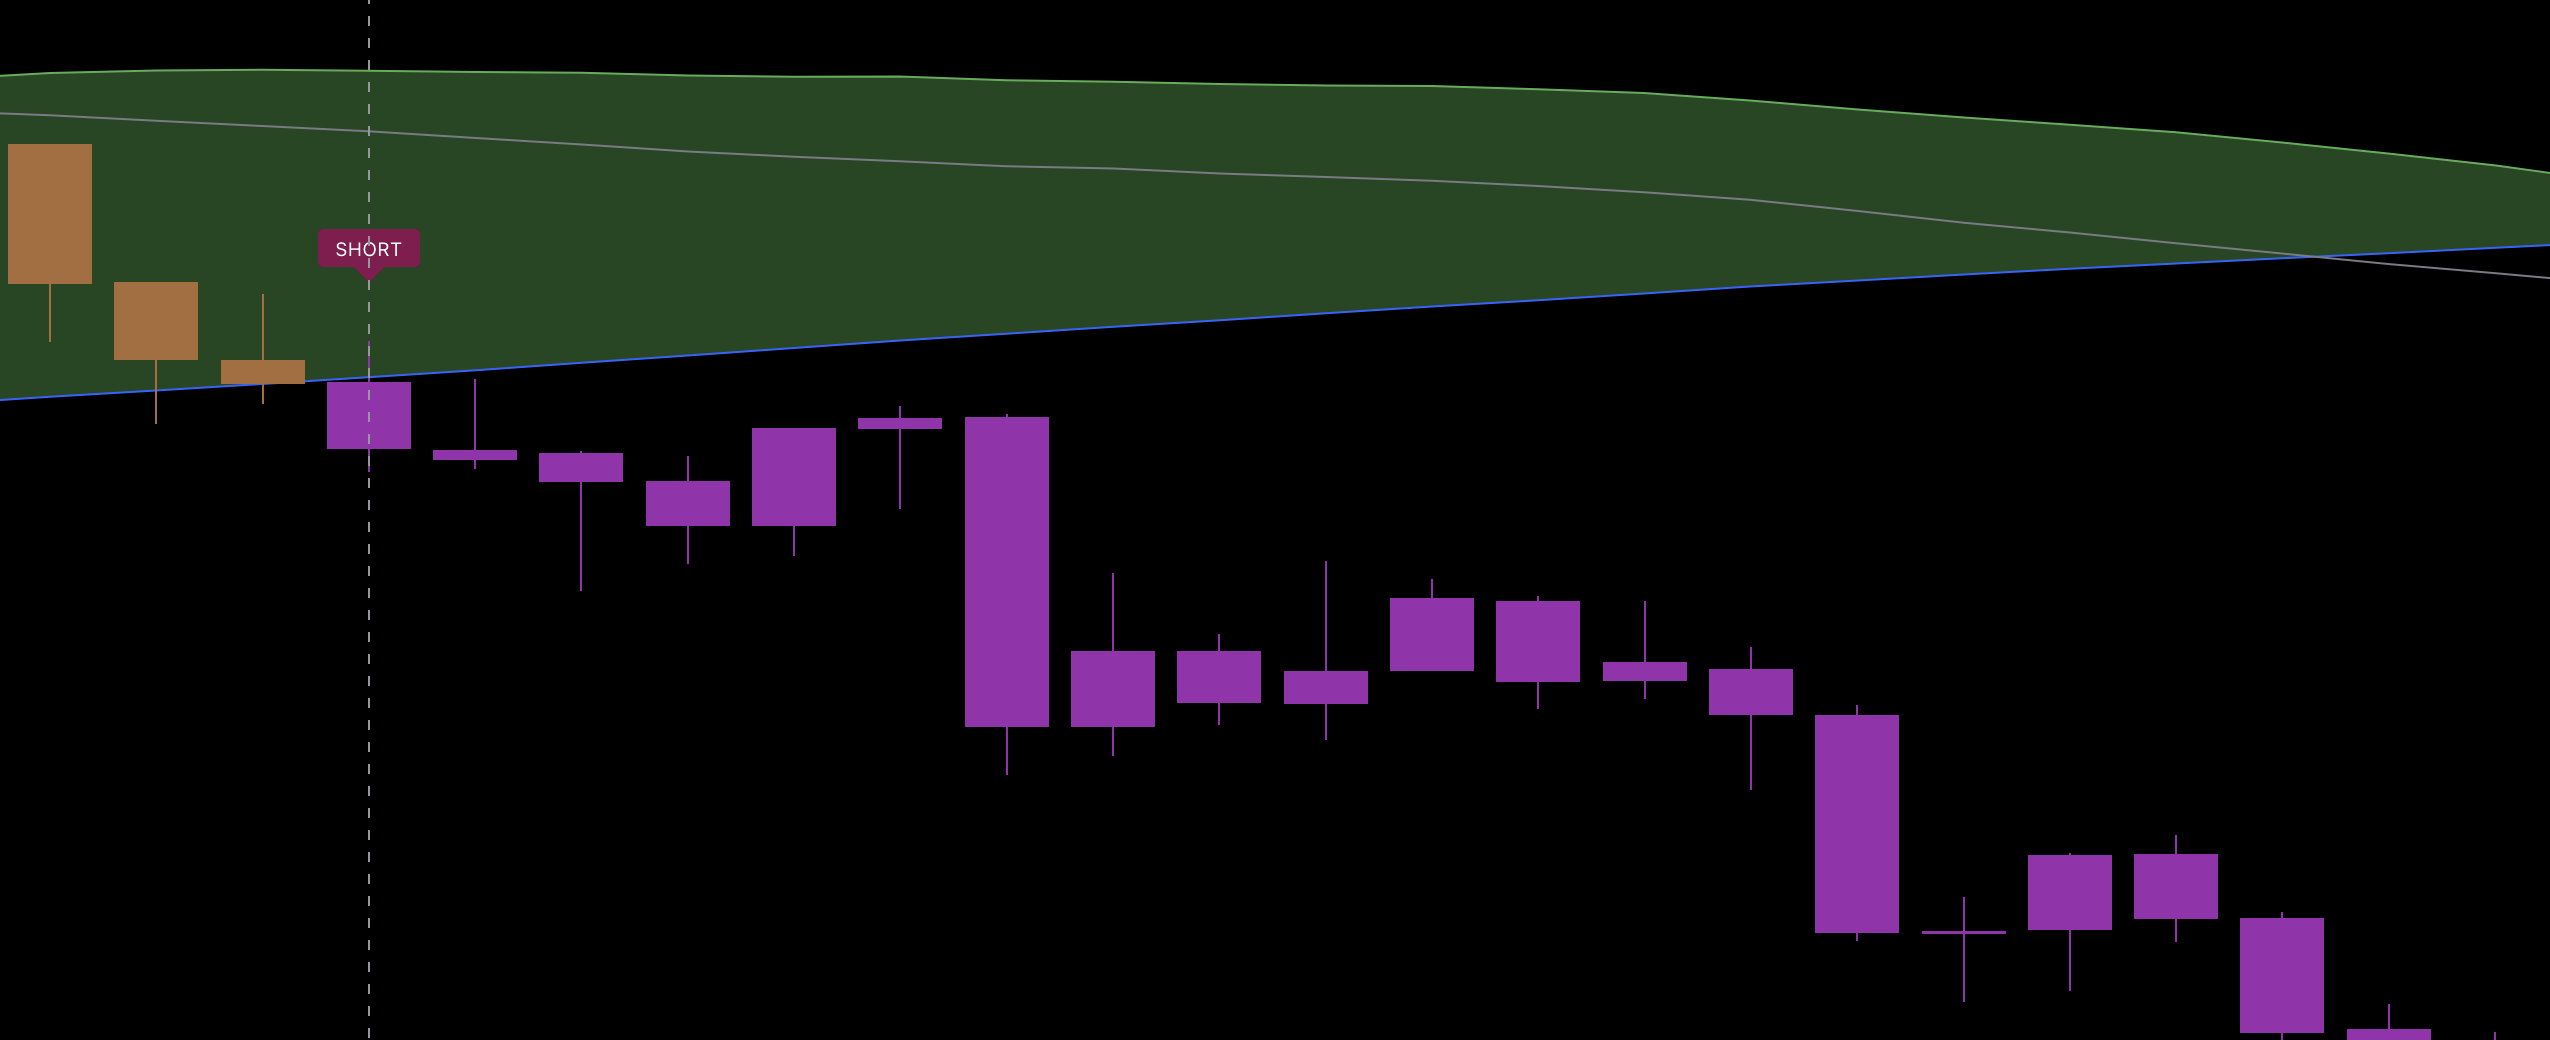
Later in the day, price reversed (so it is important to take profits along the way). When we started to trade BELOW the 50 SMA, we triggered an alert to go SHORT due to “The Reversal”
The Cash+ System Indicator will run on only the $SPX chart, but you can use those same signals given to trade other deriviates such as $SPY, $SPX, or even $_ES/$_MES Future Contracts.
For this trade, I captured 13 points from the $_MES futures on the LONG side, but left another 10 points on the table after my exit. I also caught another 10 points on the SHORT side, although I entered later as I waited for a pullback to the ORB High (which we didnt get), so then entered on the Break Hook and Go of the ORB Low level.
My trading is style is to aggressively extract profits with tight stops (scalpers mentality), however others may look for larger moves (50-100points) and will give it more room to move around. You should trade the style you prefer once the entry is given. Combining The System with the Cash+ ORB Indicator allows you to target ORB FIB Targets as good trim spots as price hits each of those targets.
As with any indicator, no signal should be used in isolation. Be aware of key levels of support and resistance, as it is always possible to get a BUY signal right under a major resistance zone, thus invalidating the trade. Stop Losses should always be in place based on your own risk tolerance, and take profits along the way when the trade is working for you.

LATEST POST

- Post By CashMoneyTrades
- Jan 11, 2023
How To Trade with Bollinger Bands

- Post By CashMoneyTrades
- Dec 03, 2022
How To Gamify Your Trading: Tips and Strategies for Adding Fun and Excitement to Your Trading Routine

- Post By CashMoneyTrades
- Dec 03, 2022